

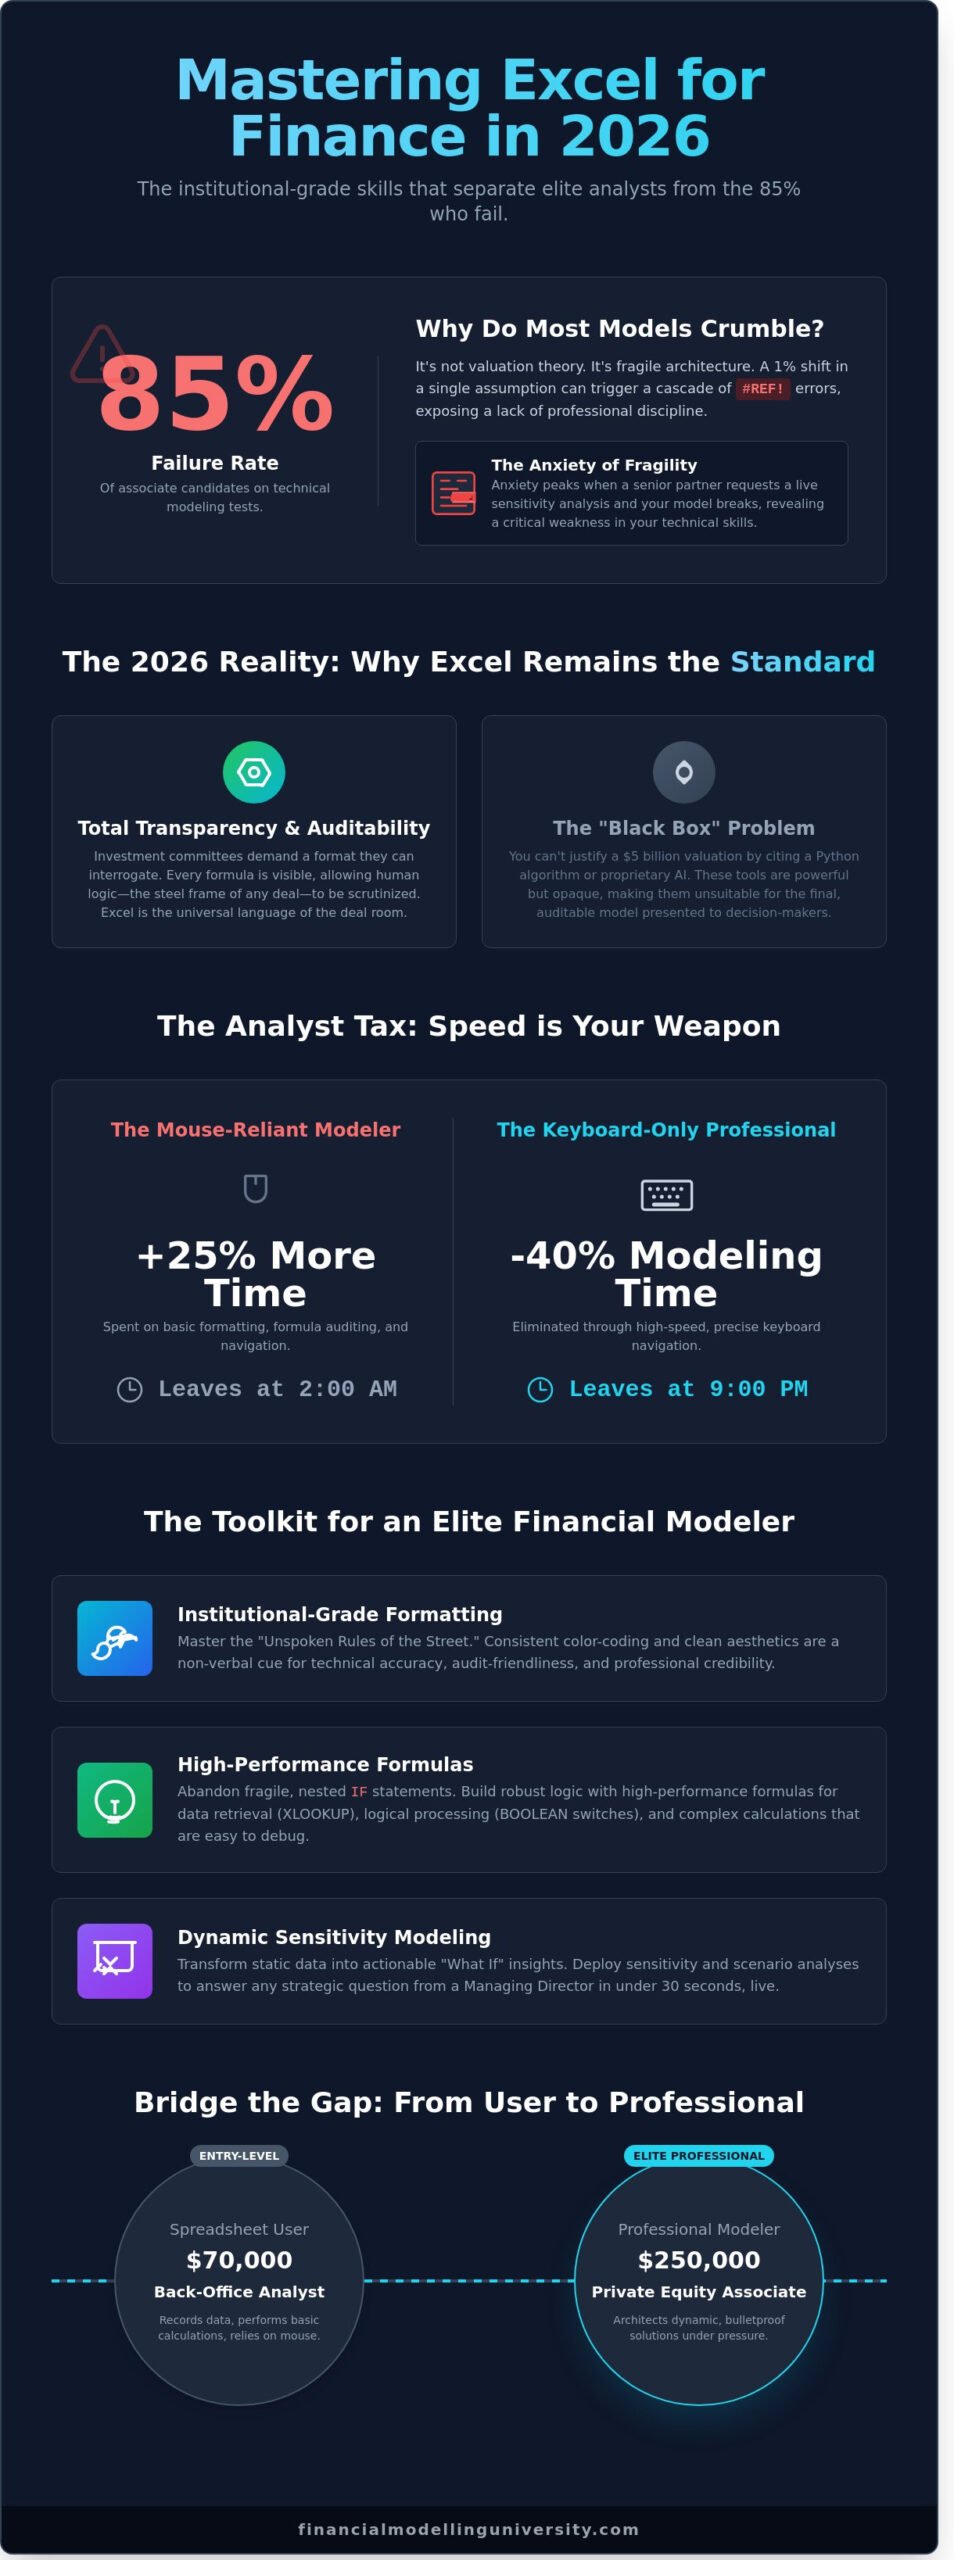
85% of associate candidates fail their technical modeling tests not because of poor valuation theory, but because their spreadsheets crumble when a single debt-to-equity assumption shifts by 1%. You likely already know that in the high-stakes environment of investment banking, a “good” model isn’t enough; it must be bulletproof. Mastering excel for finance in 2026 requires more than just knowing how to sum a column. It demands the technical rigor to build dynamic, three-statement models that remain intact under the pressure of a $500 million LBO scenario. You’ve probably felt that pang of anxiety when a senior partner asks for a sensitivity analysis and your formulas return a #REF! error because your architecture lacks professional discipline.
This guide will transform your workflow from a manual struggle into a high-speed, institutional-grade operation. We’ll show you how to eliminate 40% of your modeling time through keyboard-only navigation and precise formatting standards used at top-tier firms like Goldman Sachs or Blackstone. You’ll master the exact architecture required to build robust DCF models and complex merger consequences that pass the most rigorous technical interviews. We’re breaking down the specific logic, shortcuts, and structural frameworks that separate elite analysts from the rest of the applicant pool.
Key Takeaways
- Understand why mastering excel for finance remains the non-negotiable gatekeeper for deal-room transparency and auditability in 2026.
- Elevate your technical toolkit by replacing inefficient nested logic with high-performance formulas designed for complex data retrieval and institutional-grade processing.
- Implement the industry-standard color-coding and aesthetic rules that serve as a proxy for technical accuracy and professional credibility in elite finance.
- Master the art of dynamic modeling by deploying sensitivity and scenario analyses that transform static data into actionable “What If” insights.
- Bridge the gap between basic spreadsheet proficiency and professional modeling to accelerate your career path toward high-stakes investment banking roles.
Why Excel for Finance is Still the Ultimate Career Gatekeeper in 2026
Excel for finance is the specialized application of spreadsheet software to valuation, capital budgeting, and risk assessment. It’s the primary tool used to forecast a company’s financial performance into the future. What is Financial Modeling? It’s the act of building an abstract representation of a real-world financial situation. In 2026, this skill remains the gatekeeper for any high-stakes career in the capital markets. While data scientists use Python for massive datasets, the investment committee demands a format they can interrogate. They need to see the logic behind every EBITDA multiple. This transparency is why Excel remains the universal standard in deal rooms from New York to London.
The transition from a spreadsheet user to a financial modeler is a career-defining milestone. A user records data; a modeler architects solutions. This distinction is what separates the $70,000 back-office analyst from the $250,000 private equity associate. When you master excel for finance, you’re signaling to recruiters that you possess the technical rigor required to handle institutional-grade assets. Proficiency in this software is the “Language of the Street.” It’s a non-verbal cue that you understand how to structure a deal under pressure. If you can’t navigate a three-statement model without a mouse, you aren’t ready for the elite professional world.
The Reality of the 2026 Finance Tech Stack
In 2026, the elite tech stack combines Excel with specialized AI assistants to automate approximately 40% of rote data cleaning tasks. However, firms still reject 85% of candidates who fail the 60-minute “Modeling Test” during technical interviews. Excel stays dominant because it avoids the “Black Box” problem inherent in Python or proprietary AI tools. You can’t explain a $5 billion valuation to a board of directors by citing an algorithm. You show them the assumptions in a transparent, auditable grid where every formula is visible. Human logic remains the structural steel of every multi-billion dollar deal.
The Cost of Inefficiency: Why Speed Matters
Inefficiency carries a literal “Analyst Tax.” A modeler relying on a mouse spends 25% more time on basic formatting and formula auditing than a keyboard-only professional. This is the difference between leaving the office at 9:00 PM or 2:00 AM. In the high-pressure environment of an investment bank, speed is a psychological weapon. When a Managing Director demands a sensitivity analysis during a live presentation, you must deliver it in 30 seconds. Mastery of excel for finance ensures you aren’t the bottleneck in the room. It allows you to focus on the strategic implications of the numbers rather than the mechanics of the software.
The Financial Formula Toolkit: Moving Beyond Basic Arithmetic
Mastering excel for finance requires a shift from simple calculations to building institutional-grade systems. In the high-stakes environment of investment banking or private equity, speed is secondary to transparency. We categorize the essential toolkit into three distinct tiers: Data Retrieval, Logical Processing, and Financial Calculation. If you’re still using Excel as a glorified calculator, you aren’t modeling; you’re just typing. A professional modeler builds a dynamic engine where inputs flow through logical gates to produce predictable, auditable outputs.
Efficiency alone doesn’t define a pro. Audit-friendliness does. Senior associates often spend 70% of their time reviewing work rather than building it. If your formula wraps across four lines of the formula bar, you’ve already lost the confidence of your VP. Adhering to Institutional-Grade Formatting and transparent logic ensures your work survives rigorous peer review. This means abandoning nested IF statements. These structures are a “rookie” hallmark because they’re fragile, difficult to debug, and prone to breaking in a 50-tab model. Clean logic uses lookup tables or boolean switches instead.
Core Logic and Lookup Mastery
Dynamic data retrieval is the backbone of any 3-statement model. While VLOOKUP was the industry standard for decades, modern practitioners rely on INDEX-MATCH or XLOOKUP for their non-volatile nature and ability to look left. For a technical breakdown of why the old guard is changing, see our XLOOKUP vs. VLOOKUP guide. To handle LBO and M&A scenarios, move toward OFFSET and CHOOSE. These functions allow you to build scenario toggles, letting a user switch between “Base,” “Upside,” and “Downside” cases with a single input cell. Use IFERROR and AGGREGATE to wrap these functions, ensuring your summaries don’t collapse when a single data point is missing.
Specialized Financial Functions
Standard NPV and IRR functions are dangerous in professional modeling because they assume equal time periods. Real-world deals rarely close on the first day of the fiscal year. You must use XNPV and XIRR to account for irregular cash flow dates based on a 365-day year. In project finance, PMT and IPMT are essential for building debt schedules that accurately reflect interest and principal components over a 10-year amortization period. Beyond these, the most powerful tool is the “Boolean flag.” By using logic that results in 1 or 0, you can create timing masks that automatically turn cash flows on or off based on the model’s date headers. This eliminates manual adjustments and prevents the “hard-coding” errors that end careers.
The transition from a student to a practitioner involves moving away from complex, “clever” formulas toward simple, repeatable blocks of logic. You can master these advanced workflows and learn to build models that are both powerful and easy to audit through our structured curriculum.
Institutional-Grade Formatting: The “Unspoken Rules” of the Street
In the high-stakes environment of investment banking and private equity, your spreadsheet is a direct reflection of your professional identity. Practitioners view model aesthetics as a proxy for technical accuracy. If a model looks disorganized, an Associate or Vice President will assume the underlying math is equally unreliable. This isn’t about vanity; it’s about building institutional trust. Mastering excel for finance requires moving beyond basic functionality to adopt a rigorous visual language that signals precision to every stakeholder who opens your file.
The industry relies on a strict four-color code to ensure auditability. Hardcoded inputs must always be blue. Formulas and calculations remain black. Green is reserved for links to external workbooks, while red indicates errors, warnings, or “plug” figures that require immediate attention. Adhering to this standard allows a reviewer to understand the entire logic of a 50-tab workbook in under 120 seconds. Beyond color, the layout must follow a linear “Inputs, Calculations, Outputs” flow. This structure is a non-negotiable requirement at firms like Goldman Sachs and JP Morgan because it prevents circular references and makes the model easy to scale as deal terms evolve.
Visual clarity also demands the removal of all gridlines to create a clean, “application-like” interface. You should standardize your font to Arial or Calibri at a 10-point size and use consistent border styles to separate data sets. While foundational texts like Financial Modeling in Excel For Dummies provide a solid starting point for these conventions, elite modeling requires a level of obsessive detail where every column width is identical and every header is perfectly aligned.
The Psychology of a Clean Model
Professional formatting is designed to reduce cognitive load. When a senior decision-maker looks at a pitch book or a valuation model, they shouldn’t waste mental energy deciphering which cells are editable. A messy model is an automatic fail in 100% of investment banking modeling tests. Even if your internal rate of return (IRR) is correct to the fourth decimal, a lack of “The Rule of 1” consistency will disqualify you. This rule dictates that you must standardize units across the entire sheet; don’t mix millions and thousands. If your revenue is in millions, your EBITDA and CapEx must match that scale exactly.
Shortcuts: The Keyboard-Only Philosophy
Elite analysts treat the mouse as a significant bottleneck to productivity. The “No Mouse” challenge is a standard rite of passage in analyst training programs. If you’re caught using a trackpad during a three-statement model build, you’ve already lost the efficiency race. Speed is a competitive advantage that allows you to run multiple scenarios while your peers are still hardcoding their first case. Mastering excel for finance at a professional level means your hands never leave the keys.
You must internalize essential navigation commands to move through workbooks with surgical precision. Use Ctrl+Arrow keys to jump to the edges of data regions and Ctrl+PageUp or PageDown to toggle between tabs instantly. These movements save an estimated 40 hours of cumulative work time over a single fiscal year. For a comprehensive breakdown of the movements that define a pro, explore our list of 15 Excel Shortcuts Every Analyst Needs to Know. Developing this muscle memory is what separates a student from a practitioner capable of handling the 80-hour work weeks common in top-tier finance.
Advanced Data Analysis and Dynamic Sensitivity Modeling
A static model is a useless model. In high-stakes investment banking or private equity, your value isn’t in calculating a single number; it’s in predicting how that number shifts under pressure. Finance is fundamentally the study of variance. If your excel for finance workflow doesn’t prioritize “What If” analysis, you aren’t modeling; you’re just using a calculator. Professional practitioners demand models that breathe with the market, allowing for instantaneous adjustments when interest rates climb 50 basis points or revenue growth stalls.
You must distinguish between Sensitivity Analysis and Scenario Analysis. Sensitivity Analysis involves isolating a single variable, such as the Cost of Equity, to observe its direct impact on the Net Present Value. Scenario Analysis is more complex, requiring you to toggle a set of variables simultaneously to reflect a specific economic state. For example, a “Recession” scenario might involve a 15% drop in volume, a 200-basis-point increase in credit spreads, and a 10% reduction in capital expenditures. Mastering both is the only way to build an institutional-grade model that survives a rigorous investment committee review.
Advanced analysts utilize Goal Seek and Solver to move beyond simple data entry. When you need to size a debt tranches to maintain a 2.5x Debt Service Coverage Ratio (DSCR), Goal Seek finds the answer in seconds. If you’re optimizing a capital structure to minimize the Weighted Average Cost of Capital (WACC) while staying within specific leverage constraints, Solver provides the mathematical precision that manual trial-and-error lacks. These tools transform excel for finance from a recording device into a powerful optimization engine.
Building Robust Sensitivity Tables
The standard for visualizing valuation ranges in a DCF is the 2-way Data Table. You’ll typically plot WACC against Terminal Growth rates to create a matrix of potential outcomes. To ensure these tables don’t break, you must link the top-left corner cell directly to your output variable and use row/column inputs that reference your assumptions. A 1% swing in WACC can often move a $500 million valuation by more than 12%, making this visualization critical. Use Conditional Formatting to apply a color scale to the matrix, highlighting “deal-breaker” scenarios where the valuation falls below the purchase price. Sensitivity analysis is the bridge between financial modeling and strategic decision-making.
Scenario Managers and Dynamic Toggles
Elite models feature a centralized “Control Panel” that dictates the logic of the entire workbook. You can build this using Data Validation drop-down menus combined with the CHOOSE function. By assigning an index number to different cases-Base, Upside, and Downside-you can flip the entire model’s logic with one click. This provides a holistic view of investment risk, showing how a 2024 market downturn affects your internal rate of return. While you’re refining your data presentation, you should also consider Mastering Pivot Tables for Financial Data Analysis to handle the massive datasets that often feed into these scenarios. This dynamic approach ensures your model remains a flexible tool for real-time negotiation rather than a rigid document that becomes obsolete the moment a single assumption changes.
Ready to move beyond basic spreadsheets and start building institutional-grade models used by top-tier firms? Enroll in our Professional Modeler Program to master these advanced techniques.
From Spreadsheet User to Professional Modeler: The FMU Path
You’ve spent years learning the basics, but the gap between a standard spreadsheet user and a professional modeler is measured in millions of dollars in deal value. Understanding excel for finance is the baseline price of admission, yet it’s not the ticket to the boardroom. Most junior analysts waste 30% of their work week fixing broken links or debugging circular references. The FMU All-Access Pass changes that dynamic entirely. We provide a comprehensive ecosystem designed to transform you from someone who knows formulas to an expert who executes deals with surgical precision.
Excel is the platform, but financial modeling is the engine. You cannot have one without the other in a high-stakes environment. Our curriculum forces you to move beyond simple cell references into the architecture of multi-billion dollar transactions. We don’t just teach you how to sum a column; we show you how to structure a levered buyout that withstands the scrutiny of a credit committee. This transition requires a shift in mindset from data entry to financial engineering.
The FMU Certification Advantage
Our certification isn’t a participation trophy. It’s a validation of technical lethality. These credentials are built on the direct feedback of Managing Directors who oversee hiring at the top 10 global investment banks. When you place an FMU certificate on your resume, you’re signaling that you’ve mastered the nuances of institutional-grade modeling. You’ll gain access to a library of 150 institutional-grade Excel templates, the same frameworks used by elite associates at firms like Blackstone or Goldman Sachs to analyze cash flows. This eliminates the blank page syndrome and gives you a professional advantage that would otherwise take three years of on-the-job mistakes to acquire. You’re learning from practitioners who have actually worked at Bulge Bracket banks and Mega-Funds, ensuring every lesson is rooted in real-world application.
Your Career Acceleration Plan
Success in high finance requires a roadmap, not a random collection of tutorials. Our Career Acceleration Plan is a structured three-step progression designed to make you indispensable by the 2026 recruitment cycle:
- Step 1: Master the excel for finance foundations, drilling keyboard efficiency until you can navigate complex workbooks without touching a mouse.
- Step 2: Build the core 3-statement model, linking the income statement, balance sheet, and cash flow with absolute precision.
- Step 3: Specialize in complex deal structures, including DCF valuation, LBO modeling, or M&A analysis.
Our mentors, who have collectively closed deals totaling over $50 billion, provide the 1-on-1 guidance needed to navigate the competitive recruitment landscape. You aren’t just learning a software skill; you’re building the foundation for long-term financial leadership. It’s time to stop guessing and start executing at an elite level.
Join the Financial Modelling University and Master Excel for Finance Today. Secure your spot in the next cohort of investment professionals and take control of your career trajectory.
Own the Desktop and Secure Your Seat at the Table
The landscape of 2026 demands more than just basic spreadsheet literacy. It requires a mastery of excel for finance that aligns with the rigorous standards of global investment banks and private equity firms. You’ve seen how institutional-grade formatting and dynamic sensitivity modeling separate the analysts who merely survive from those who lead the deal team. By moving beyond simple arithmetic into complex, three-statement integration, you position yourself as an indispensable asset in any high-stakes environment. Precision is the only currency that matters in this field.
Theory alone won’t secure your spot in a competitive recruitment cycle. You need the technical rigor of a practitioner and the credentials to prove it. Financial Modelling University provides the exact roadmap used by top-tier firms. Our members gain access to 150+ downloadable institutional-grade Excel templates and receive direct, 1-on-1 career mentoring from IB and PE veterans with over 20 years of combined street experience. These globally recognized certifications don’t just fill a resume; they validate your technical superiority to every hiring committee.
Don’t leave your professional trajectory to chance. Elevate your career with the FMU All-Access Pass and start building the foundation for your long-term leadership in the industry. Your future in high-finance starts with the next cell you link.
Frequently Asked Questions
How long does it take to learn Excel for finance?
It takes approximately 100 to 150 hours of deliberate practice to move from a beginner to a professional level in excel for finance. This timeframe assumes a focus on core competencies like three-statement modeling and DCF analysis. Industry data from the Financial Modeling World Cup suggests that 40 hours of focused training can bridge the gap between basic utility and associate-level proficiency.
Is Excel still used in investment banking in 2026?
Excel remains the industry standard for investment banking in 2026, with over 95% of bulge bracket firms relying on it for M&A and LBO modeling. While Python and Power BI have gained traction for data visualization, the flexibility of the Excel grid is unmatched for complex deal structuring. Senior bankers require the transparency of formula-driven models that can be audited instantly during live negotiations.
What are the top 5 Excel formulas for finance professionals?
The five essential formulas for institutional-grade modeling are XLOOKUP, INDEX, MATCH, NPV, and XIRR. XLOOKUP has replaced 90% of legacy VLOOKUP use cases since its 2019 release due to its superior error handling. XIRR is the non-negotiable metric for private equity returns, while INDEX and MATCH provide the structural integrity needed for dynamic scenario analysis in a 10-year forecast.
Do I need to learn VBA for financial modeling?
You don’t need VBA for 95% of standard financial modeling tasks, as modern features like Power Query and Dynamic Arrays have rendered most macros obsolete. VBA is still utilized for specific tasks like automating Monte Carlo simulations or clearing inputs in complex LBO models. You should prioritize mastering robust formula logic and clean model architecture before touching the developer tab.
What is the best way to practice Excel for finance at home?
The most effective practice method is rebuilding a three-statement model from a 10-K filing of a public company like Apple or Microsoft. Dedicate 2 hours daily to manual data entry and formula construction without using templates. This “blank sheet” approach forces you to understand the interdependencies between financial statements that define excel for finance mastery.
What is the “No Mouse” rule in financial modeling?
The “No Mouse” rule is a professional standard requiring analysts to navigate and build models using only keyboard shortcuts to increase speed by 30%. In high-pressure environments like Goldman Sachs or JP Morgan, reaching for the mouse is seen as a sign of inefficiency. Mastery of Alt-key sequences and Ctrl-driven navigation allows an elite modeler to execute complex tasks in half the time.
Can I use Google Sheets for professional financial modeling?
Google Sheets is insufficient for professional financial modeling because it lacks the processing power and advanced auditing tools required for 50MB transaction models. While 60% of startups use it for basic budgeting, it fails to handle the complex circularity and sensitivity tables common in private equity. Professional-grade work requires the desktop version of Excel to ensure calculation precision and data security.
How do I pass a financial modeling test for an interview?
To pass a 3-hour modeling test, you must be able to build a fully integrated three-statement model from scratch in under 90 minutes. Focus on zero-error formatting and internal consistency checks where the balance sheet must balance on the first attempt. 85% of candidates fail because they prioritize complexity over a clean, auditable structure that a VP can review in 5 minutes.