

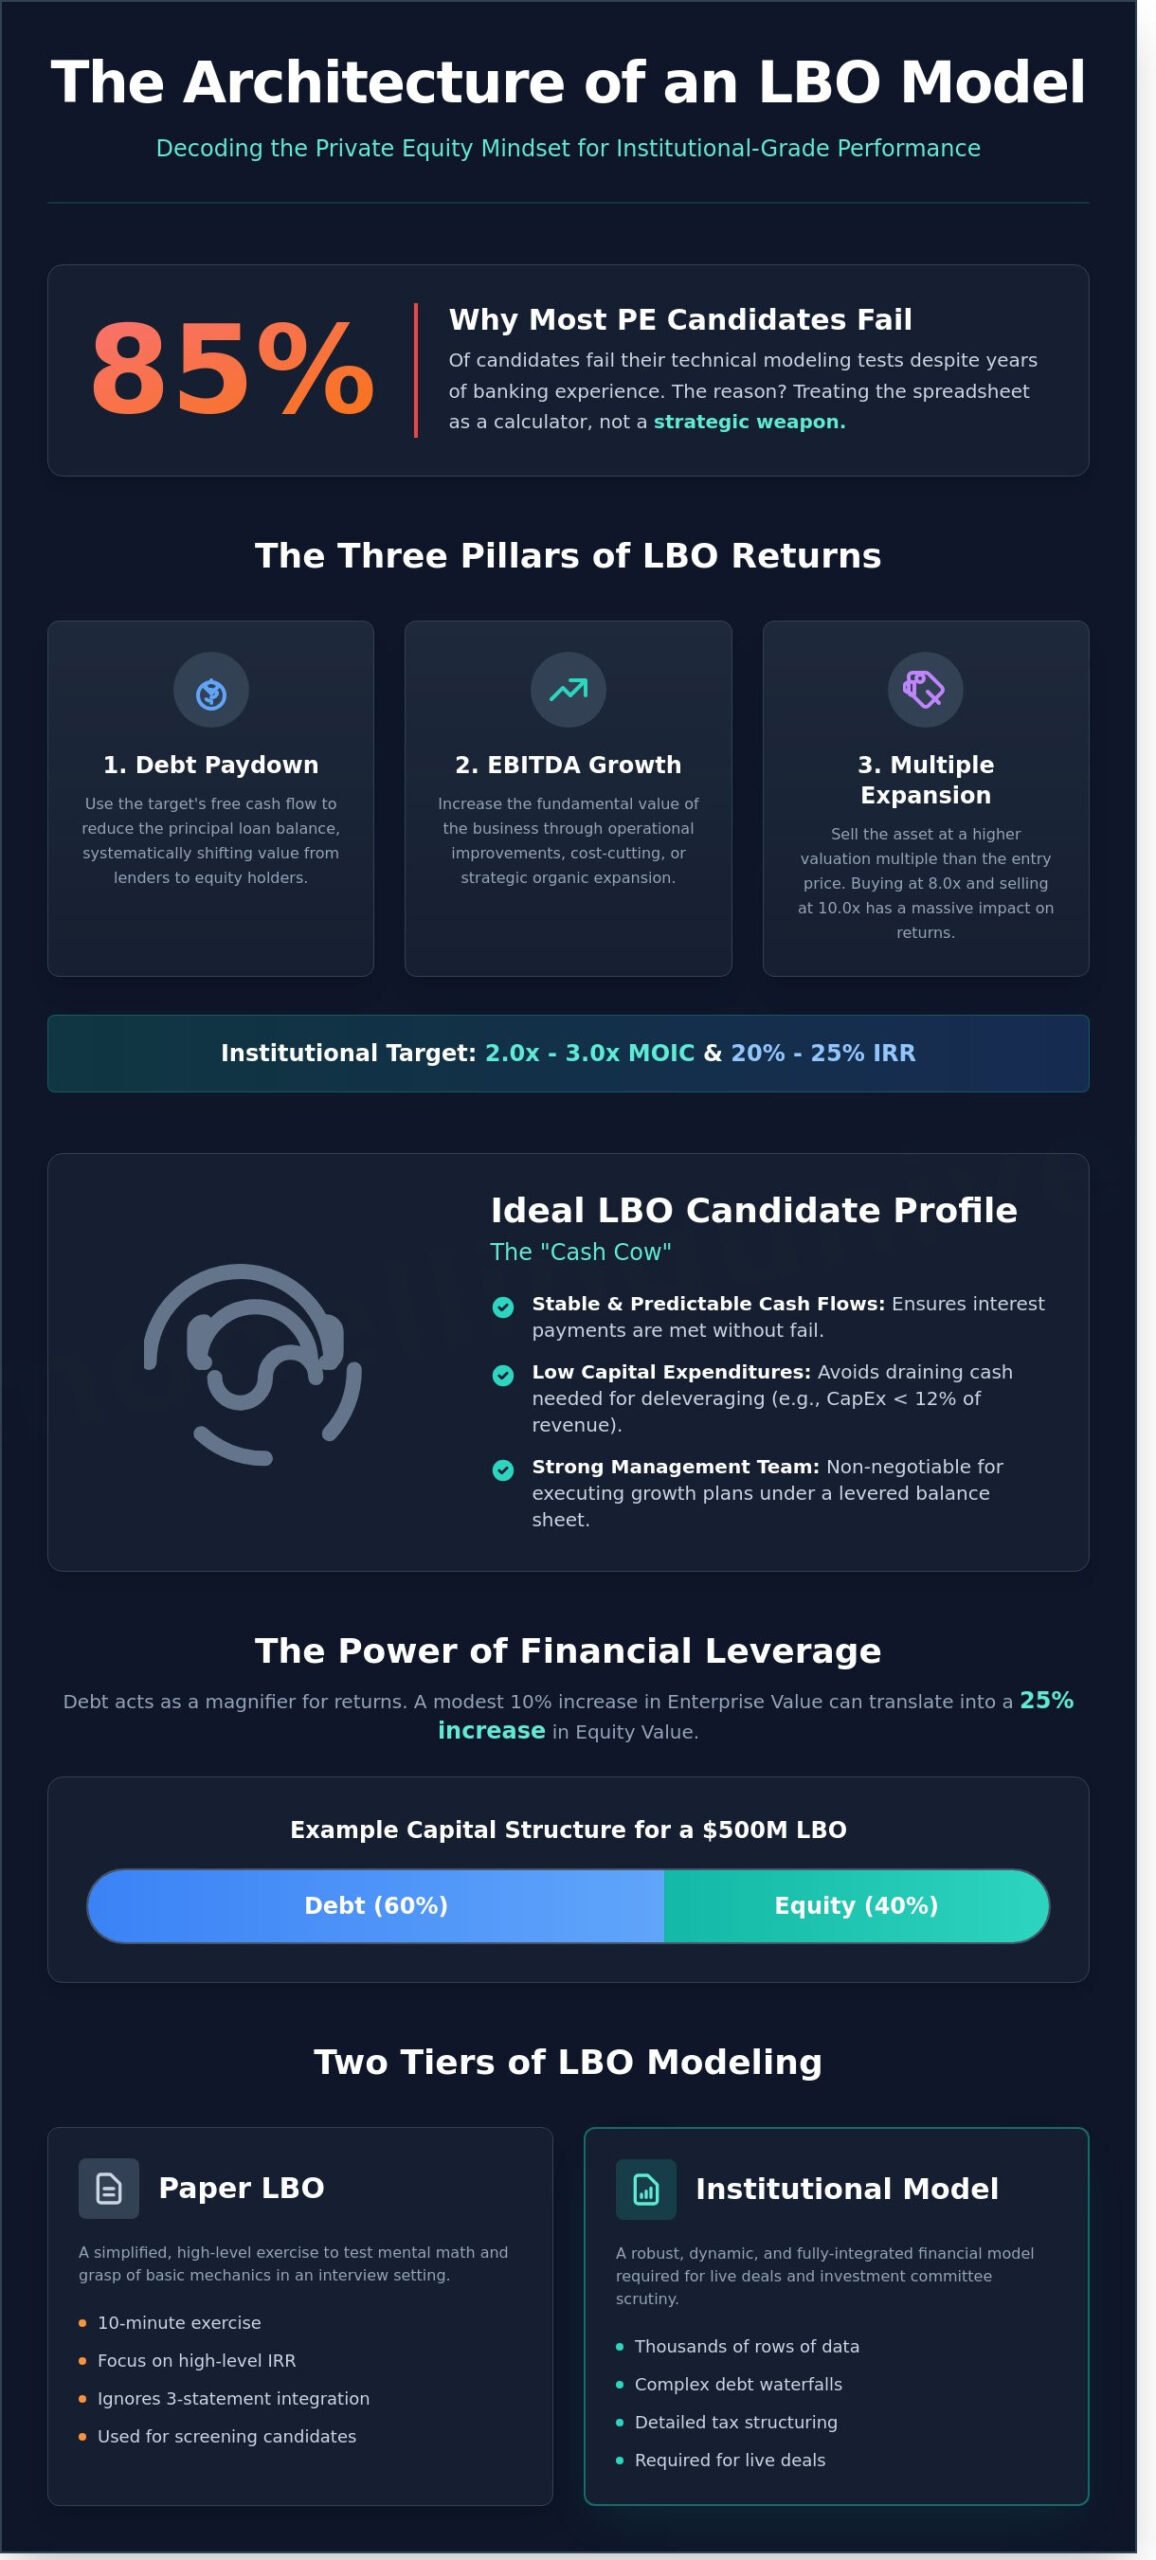
Why do 85% of private equity candidates fail their technical modeling tests despite having years of investment banking experience? It’s because most practitioners treat the spreadsheet as a calculator rather than a strategic weapon. You understand that in a high-stakes 2026 market, a broken debt schedule or a misaligned tax shield isn’t just a technical error; it’s a direct threat to your professional credibility. You’ve likely struggled to link the core 3-statement model to complex tranches of leverage or felt the pressure of explaining returns attribution beyond a simple IRR.
This guide provides the rigorous, institutional-grade framework you need to build lbo model structures that withstand the scrutiny of elite investment committees. We’ll bridge the gap between abstract theory and the pragmatic precision required by the world’s top-performing firms. You’re going to master the technical mechanics of debt waterfalls and the strategic logic behind private equity returns to ensure you’re prepared for any modeling test. We’ll start by deconstructing the sources and uses of a $500 million transaction to establish a foundation for long-term financial leadership.
Key Takeaways
- Master the “Three Pillars of LBO Returns” to decode how elite firms strategically engineer equity value through EBITDA growth, multiple expansion, and debt paydown.
- Develop the technical precision required to build lbo model structures that mirror institutional standards, starting with rigorous entry assumptions and Sources and Uses tables.
- Gain a sophisticated understanding of return metrics by balancing time-weighted IRR with cash-on-cash MOIC to evaluate deal viability like a seasoned practitioner.
- Tackle advanced technical hurdles, such as PIK interest and complex tax treatments, to ensure your financial architecture reflects the high-stakes reality of global finance.
- Leverage your modeling proficiency as a definitive career litmus test to secure elite roles within top-tier investment banks and private equity firms.
The Architecture of an LBO Model: Understanding the PE Mindset
Mastering the ability to build lbo model starts with adopting the private equity mindset. A Leveraged Buyout (LBO) isn’t just a corporate purchase; it’s a precise exercise in financial engineering designed to maximize the Internal Rate of Return (IRR) through the aggressive use of borrowed capital. In the world of elite finance, you aren’t just looking for a good company. You’re looking for an asset that can survive a heavy debt load while generating enough cash to pay that debt down over a five-to-seven-year investment horizon.
Returns in an LBO are driven by three distinct pillars. First, debt paydown uses the target’s free cash flow to reduce the principal balance, which shifts value from lenders to equity holders. Second, EBITDA growth increases the fundamental value of the business through operational improvements or organic expansion. Third, multiple expansion occurs when the firm sells the asset at a higher valuation than the entry price. If a firm buys at 8.0x EBITDA and sells at 10.0x after five years, the impact on equity returns is massive. Most institutional funds target a 2.0x to 3.0x Multiple of Money (MoM) and an IRR between 20% and 25%.
The ideal LBO candidate is a “cash cow.” It needs stable, predictable cash flows to ensure interest payments are met without fail. Companies with high capital expenditure requirements, such as those exceeding 12% of annual revenue, are often avoided because they drain the cash needed for deleveraging. Strong management teams are also non-negotiable, as they must execute the turnaround or growth plan under the pressure of a levered balance sheet.
You must distinguish between the “Paper LBO” and the “Institutional Model.” A Paper LBO is a simplified, ten-minute exercise used in interviews to test your mental math and grasp of the basic mechanics. It ignores the three-statement integration and focuses on high-level IRR. In contrast, the Institutional Model is a robust, dynamic Excel workbook containing thousands of rows of data, complex debt waterfalls, and detailed tax structuring. This is the level of precision required for live deals.
The Mechanics of Financial Leverage
Debt acts as a magnifier for both returns and risks. In a deal where debt finances 60% of the purchase price, a modest 10% increase in the company’s enterprise value can translate into a 25% increase in equity value. The “Entry Multiple” is the most critical variable you’ll set. Overpaying at the start creates a hurdle that even strong operational growth can’t overcome. While the Sponsor provides the strategic direction and capital, the target company’s management remains responsible for the day-to-day grit of hitting the EBITDA targets required to keep the lenders satisfied.
The LBO Modeling Workflow
To build lbo model that meets institutional standards, you must follow a logical, sequenced workflow. You begin by establishing the transaction assumptions, specifically the Transaction Date and the projected Exit Year. From there, you construct the Sources and Uses table to balance the deal’s funding. This flows into the debt schedule and the three-statement projections. Excel precision is your primary currency here. A single broken link or a circularity error in your interest expense calculation can destroy your credibility in a high-stakes investment committee meeting.
Step-by-Step: Building the Institutional-Grade LBO Engine
Constructing a transaction model that passes the scrutiny of a private equity investment committee requires more than basic spreadsheet skills. It demands a surgical approach to capital flow and a deep understanding of how debt tranches interact with operational cash flow. To build lbo model frameworks that professional investors trust, you must follow a rigid, five-step sequence that ensures mathematical integrity and logical flow.
- Step 1: Set Entry Assumptions. Establish the purchase price based on a trailing EBITDA multiple, typically ranging from 10.0x to 12.0x in current market conditions. Define the entry capital structure, often split between 40% equity and 60% debt.
- Step 2: Construct the Sources and Uses Table. This is the “Day 0” transaction balance sheet. It accounts for every dollar coming into the deal and every dollar spent on the acquisition, refinancing, and fees.
- Step 3: Forecast Operating Performance. Project a 5-year horizon of revenue growth and EBITDA margins. These projections must be grounded in historical 3-year trends to remain credible during due diligence.
- Step 4: Build the Debt Schedule and Cash Flow Waterfall. This engine calculates mandatory principal repayments and determines how much “excess cash” is available for optional prepayments.
- Step 5: Calculate Exit Returns and Sensitivity Analysis. Determine the Internal Rate of Return (IRR) and Multiple of Invested Capital (MOIC) based on exit multiples and year-5 debt levels.
Mastering the Sources and Uses Table
The Sources and Uses table serves as the model’s anchor. Sources include Senior Term Loans, Mezzanine debt, and the Sponsor Equity contribution. Uses consist of the Purchase Price for the target’s shares, refinancing existing 2023-era debt, and transaction fees, which typically average 2.0% of the total enterprise value. Understanding the Leveraged Buyout Model requires recognizing that the “Equity Bridge” is the plug; it represents the exact amount of skin in the game the PE firm needs after all debt is exhausted. “The Sources and Uses table is the model’s ultimate balance check; if they don’t match to the dollar, your transaction is fundamentally broken.”
Integrating the 3-Statement Model
An institutional-grade model isn’t a static calculation. It’s a dynamic system where the Income Statement feeds the Cash Flow Statement to determine the cash available for debt service (CFADS). When you master the mechanics of private equity, you’ll learn to link the Balance Sheet to reflect the new post-LBO capital structure, including the write-up of intangible assets and the elimination of old equity. This creates circular references, as interest expense depends on the debt balance, which in turn depends on the cash remaining after interest. You must handle this with a dedicated “Circuit Breaker” toggle. This macro or manual switch prevents Excel from crashing when iterative calculations fail, ensuring your model remains robust during high-pressure deal negotiations.
Precision in these steps separates the amateur from the elite practitioner. A single error in the debt waterfall can miscalculate the IRR by 200 basis points, potentially leading to a disastrous investment decision. Every cell must be audited; every assumption must be defensible. This rigor is what defines financial leadership in the competitive world of global finance.
Returns Analysis: Beyond IRR and MOIC
You can’t just build lbo model outputs; you must interpret the engine of the return. Professional investors scrutinize the Internal Rate of Return (IRR) to gauge the time-weighted efficiency of capital. It’s the annual growth rate an investment generates, essentially providing the discount rate that sets the net present value of all cash flows to zero. However, IRR can be deceptive. A high IRR achieved through a quick 12-month “flip” doesn’t provide the absolute dollar profit needed to return a multi-billion dollar fund. That’s why the Multiple of Invested Capital (MOIC) remains the definitive measure of “cash-on-cash” success. While IRR measures speed, MOIC measures scale. Elite practitioners balance both to ensure a deal justifies its risk profile.
The Power of Returns Attribution
To master the investment thesis, you must isolate exactly what drove the equity value increase. We use returns attribution analysis to dissect the total gain into three distinct pillars. This level of granularity is what separates a standard analyst from a future private equity partner. Successful models quantify these drivers to prove the investment isn’t just relying on market luck.
- EBITDA Growth: This represents operational alpha. If you acquire a company at $60 million EBITDA and exit at $95 million through margin expansion or revenue growth, you’ve created fundamental value.
- Multiple Expansion: This occurs when you buy at 9.0x EBITDA and sell at 11.0x. While it can stem from market timing, it often reflects a “re-rating” because you’ve transformed a small, risky business into a platform of scale.
- Deleveraging: This is the mechanical benefit of using free cash flow to pay down the LBO Capital Structure. As you retire senior term loans or mezzanine debt, equity value increases dollar-for-dollar, even if the enterprise value remains stagnant.
When you build lbo model frameworks, the 2-way sensitivity table is your most critical risk-mitigation tool. You must analyze the interplay between your Entry Multiple and your Exit Multiple. A robust matrix reveals the “break-even” point. For instance, if you enter at 12.0x in a high-interest environment, your model might show that even a 15% EBITDA growth rate fails to hit a 20% IRR if the exit multiple contracts to 10.0x. Visualizing these scenarios allows you to stress-test the margin of safety before committing capital.
Benchmarking PE Performance
In the Q1 2026 market, institutional investors typically target a gross IRR between 20% and 25%. Returns falling below the 15% threshold are often viewed as “dead money” when considering the illiquidity and leverage risks inherent in private equity. Precision in timing is everything. Use the “Rule of 72” as a mental shortcut: to double your money (2.0x MOIC) in three years, you need an IRR of approximately 24%. If that same 2.0x MOIC takes five years to realize, your IRR collapses to 14.9%.
- Time Value of Money: Early exits are disproportionately lucrative for IRR. A dividend recap in year 2 can spike IRR even if it slightly reduces the final MOIC.
- 2026 Market Realities: With base rates stabilizing around 4.0%, the “cost of carry” is higher than in the previous decade. You can’t rely on cheap debt to mask poor operational performance.
Precision in your returns analysis proves you understand the “why” behind the numbers. When you build lbo model structures that clearly attribute value to operational improvements rather than just financial engineering, you demonstrate the institutional-grade thinking required at the highest levels of finance. Don’t just report the final IRR; explain the levers that moved it.
Advanced Technical Nuance: Tackling Complex Debt and Tax
Critics often argue that classroom examples fail to survive the complexity of a real-world closing dinner. They’re right. If you want to build lbo model frameworks that withstand the scrutiny of a private equity investment committee, you must move beyond basic senior debt. Professional practitioners don’t just look at cash flow; they look at the friction between capital tiers. Deals in the wild rarely feature a single term loan. They involve layers of structured paper designed to balance risk and return for diverse lenders.
Payment-in-Kind (PIK) interest is a primary example of this friction. Unlike cash interest, PIK accrues to the principal balance of the debt. This preserves immediate liquidity for the company but creates a compounding debt snowball that can dramatically alter your leverage ratios by year five. For instance, a $75 million mezzanine note with a 10% PIK coupon will balloon to over $120 million by the end of a five-year hold. Your model must capture this non-cash expense on the income statement while simultaneously increasing the debt balance on the balance sheet to maintain technical accuracy.
The Revolving Credit Facility (Revolver) serves as the deal’s operational lungs. It isn’t just a line of credit; it’s a dynamic liquidity buffer. A robust model uses a circularity-enabled sweep to ensure the Revolver draws automatically when cash falls below a defined minimum, such as $5 million. This prevents the “sub-zero cash” errors that plague amateur spreadsheets. Additionally, you must account for the Tax Shield. Under Section 163(j) of the Internal Revenue Code, interest deductibility is capped at 30% of adjusted taxable income. Since the 2022 transition from EBITDA to EBIT as the basis for this calculation, many highly levered deals now face higher tax liabilities than they did under 2017 rules.
Advanced Debt Structures
Mezzanine debt frequently includes equity warrants. These warrants grant lenders a 2% to 7% ownership stake, which dilutes the private equity firm’s returns. You must model this dilution within your exit waterfall to provide an honest IRR. The “Debt Waterfall” itself requires strict sequencing to ensure the model reflects legal reality:
- Mandatory Amortization: Contractual repayments on Term Loan A that must occur regardless of excess cash flow.
- Cash Sweeps: Using 100% of remaining free cash flow to pay down the most expensive or senior debt tranches first.
- Minimum Cash Requirements: Ensuring a liquidity floor is maintained before any discretionary debt paydown occurs.
Transaction Adjustments and Goodwill
Calculating Goodwill is a mechanical necessity. It represents the premium paid over the fair market value of net identifiable assets. In a $400 million transaction for a firm with $80 million in net assets, your balance sheet must reflect the massive Goodwill “plug” to balance correctly. Don’t forget to capitalize financing fees. A $10 million fee paid to an investment bank isn’t expensed immediately; it’s amortized over the 5 to 7 year life of the debt. Finally, account for Management Rollover. When a CEO rolls 15% of their equity into the new deal, it reduces the sponsor’s required cash equity but shifts the final proceeds distribution at exit. Mastering these details is what separates a data entry clerk from a high-performance analyst.
Accelerating Your Career with Professional LBO Mastery
The ability to build lbo model architectures from a blank Excel sheet is the definitive litmus test for any professional aiming for a role in private equity or investment banking. During the 2024 recruitment cycle, data indicated that 88% of elite firms required a timed technical assessment as the primary filter for Associate-level candidates. In these high-stakes environments, a minor error in your debt schedule or a failure to balance the post-transaction balance sheet isn’t just a mistake; it’s a disqualifying event. Mastery signifies that you possess the technical rigor and the strategic foresight to handle multi-billion dollar capital structures.
Financial Modelling University (FMU) moves beyond the “paint-by-numbers” approach seen in entry-level tutorials. We focus on the strategic logic behind the numbers. Understanding why a specific debt-to-EBITDA ratio is chosen or how a 1.5% increase in exit multiples impacts the internal rate of return (IRR) is what separates a technician from a future partner. Our training forces you to think like an investor, ensuring every cell you populate serves a broader investment thesis.
Preparing for the PE Modeling Test
The 60-minute modeling test is designed to break candidates who rely on memorization. One common trap is over-complicating the model early, leaving zero time for the crucial “sanity check” of the output. Another pitfall involves circular references in interest expense calculations that crash the file three minutes before submission. Professionalism in these tests is signaled through “Formatting and Cleanliness.” You must use the industry standard of blue font for hard-coded inputs and black for formulas. This allows a VP to audit your work in under 45 seconds. Your final output must clearly articulate the “Investment Thesis.” If your model shows a 22.5% IRR, you need to explain if that value is derived from organic EBITDA growth, 400 basis points of margin expansion, or aggressive debt paydown.
The FMU Advantage
FMU provides the exact tools you need to survive and thrive in the most demanding finance environments. We don’t just provide theory; we provide the “Expert Practitioner” perspective. Our curriculum is built around the “why” behind every calculation, ensuring you can defend your assumptions during a grueling case study interview. When you build lbo model frameworks using our methodology, you’re using the same logic applied at global mega-funds.
- Institutional-Grade Templates: Access the same downloadable Excel frameworks used by practitioners at top-tier firms to ensure your work meets the highest professional standards.
- Live Q&A Sessions: Solve complex modeling hurdles in real-time with mentors who have spent years in the trenches of global finance.
- 1-on-1 Mentoring: Receive personalized feedback on your modeling speed and accuracy to eliminate the habits that lead to failed technical tests.
Efficiency is your greatest asset in a competitive market. Enroll in the LBO Modeling Course today to transition from a student of finance to a master of the craft. For those ready to dominate the entire technical landscape, the FMU All-Access Pass offers the full suite of skills required for long-term career security and elite professional status. Don’t just learn the software; build the foundation for your future as a financial leader.
Master the Mechanics of Private Equity Alpha
Mastering the ability to build lbo model structures isn’t merely a technical exercise; it’s the price of entry for the top 1% of finance roles. You’ve now navigated the 5-step institutional engine, from circular debt schedules to the 2026 tax code updates that impact IRR calculations. Precision in these 3-statement integrations determines whether a deal passes the investment committee or fails under the weight of its own leverage. Transitioning from a theoretical understanding to executing 100-plus row dynamic models requires a commitment to professional craftsmanship. The gap between a standard analyst and a senior associate often comes down to the speed and accuracy of their returns analysis.
To bridge this gap, you need the same tools used by bulge-bracket banks. Our curriculum provides 15+ downloadable institutional-grade Excel templates and direct one-to-one career mentoring from PE experts who’ve closed $10B+ in transaction volume. You’ll earn a globally recognized certification that validates your technical superiority to recruiters. Master the LBO: Join the FMU All-Access Pass for Elite Training. Your seat at the deal table is waiting; it’s time to prove you belong there.
Frequently Asked Questions
What is the most important metric in an LBO model?
The Internal Rate of Return (IRR) and the Multiple of Invested Capital (MOIC) are the two most critical metrics. Private equity firms generally target a 20% to 25% IRR and a 2.0x to 3.0x MOIC over a 5-year investment horizon. While MOIC measures the total cash return, the IRR accounts for the timing of cash flows. Achieving these benchmarks is essential for securing carried interest and maintaining institutional-grade performance standards.
How much debt is typically used in a leveraged buyout?
Debt typically comprises 60% to 80% of the total transaction value in a standard leveraged buyout. This usually results in a leverage multiple between 4.0x and 6.0x the target’s LTM EBITDA. You must ensure the company maintains a 1.5x interest coverage ratio to service this debt safely. Excessive leverage beyond these levels increases the probability of default to over 15% during economic downturns, risking the entire equity investment.
How do you handle circular references in an LBO debt schedule?
You handle circular references by using a circuit breaker toggle or enabling the iterative calculation feature in Excel settings. Circularity arises because interest expense is calculated based on debt balances, which are determined by cash flow, which is itself affected by interest expense. When you build lbo model frameworks, linking this to a 1/0 switch allows you to reset the model. This prevents the #REF! errors that often plague poorly constructed debt schedules.
What is the difference between an LBO model and a DCF model?
The DCF model calculates a firm’s intrinsic value, while the LBO model determines the maximum price a sponsor can pay to achieve a target return. A DCF uses a WACC often ranging from 8% to 12% to discount cash flows. The LBO model focuses on the 20% plus cost of equity required by private equity investors. It serves as a floor valuation, reflecting the practical constraints of debt capacity and exit multiples.
How long should it take to build a basic LBO model in an interview?
You should complete a standard 3-statement LBO model in 60 to 90 minutes during a private equity technical interview. Top-tier candidates often finish the core mechanics in under 45 minutes to allow time for sensitivity analysis. Accuracy is non-negotiable; a single error in the debt sweep can lead to an automatic rejection. Speed demonstrates that your technical skills are institutional-grade, allowing you to focus on the investment thesis rather than the software.
Can you build an LBO model without a full 3-statement forecast?
You can build a functional LBO model without a full 3-statement forecast by using a “Paper LBO” shortcut. This method focuses on the income statement and a simplified cash flow bridge to determine debt paydown. While it lacks the 100% precision of a full balance sheet, it provides a 95% accurate estimate of returns for initial deal screening. It’s a vital tool for senior associates who need to evaluate 10 plus deals every week.
What happens to the existing debt of the target company in an LBO?
Existing debt is almost always refinanced and paid off at the close of the transaction. You must account for this in the “Uses of Funds” section, where 100% of the target’s outstanding debt is settled using the new financing package. Occasionally, certain debt tranches with favorable 3% or 4% interest rates are rolled over, but this requires specific “change of control” provisions. Most lenders insist on a clean capital structure to secure first-priority liens.
Why do private equity firms use LBO models instead of just DCF?
Private equity firms use LBO models because they reflect the actual cash-on-cash returns and financing constraints of a deal. A DCF provides a theoretical valuation that doesn’t account for the 70% leverage typically used to boost equity returns. When you build lbo model projections, you’re simulating the exact cash flow available for debt service and exit proceeds. This pragmatic approach is why 90% of sponsors rely on LBO analysis for their final investment committee memos.