

Finance teams are among the heaviest Excel users in any organization, yet a significant portion of their time disappears into tasks that should never require human attention: copying data between sheets, reformatting reports, and re-running the same calculations with slightly different inputs.
The result is slower analysis, higher error risk, and analysts spending their sharpest hours on work that a well-written script could handle in seconds.
According to McKinsey Global Institute’s research, the average knowledge worker spends nearly 20% of their working week just searching for and gathering information — before any actual analysis begins.
For finance professionals dealing with large datasets and multi-sheet models, that number compounds quickly.
What Is VBA in Excel?
VBA Excel refers to Visual Basic for Applications, as it is used inside Microsoft Excel to automate actions, build custom functions, and control workbook behavior.
VBA, or Visual Basic for Applications, is Microsoft’s programming language embedded directly into Excel and other Office applications. It was designed specifically to extend what these applications can do beyond their built-in capabilities, allowing users to write instructions that Excel executes automatically.
The key distinction worth understanding early: Excel’s native functions, such as SUM, VLOOKUP, or INDEX MATCH, are static. They respond to data but cannot independently trigger actions, loop through thousands of rows, or make decisions based on changing conditions. VBA does all of that.
It interacts with every element of a workbook, including cells, sheets, charts, and external data sources, through objects that can be read, written to, and manipulated programmatically.
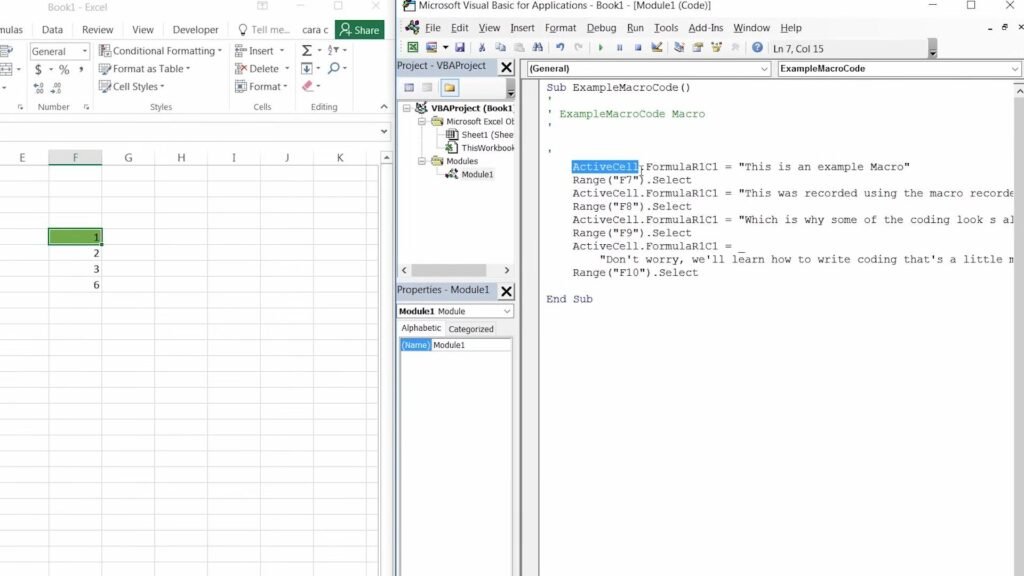
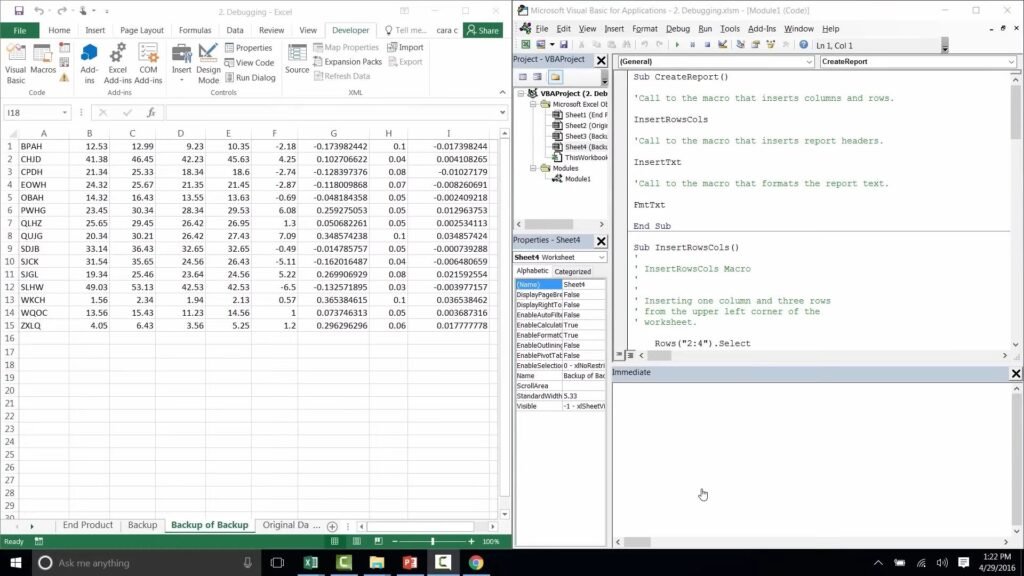
To access the VBA environment in Excel, press ALT + F11. This opens the Visual Basic Editor, which is where all code is written, stored, and run. The editor contains a Project Explorer for navigating your workbook structure, a Code Window where scripts are written, and a Properties Window for configuring object settings. No installation is required. If you have Excel, you already have VBA.
One important clarification on terminology: a macro is not the same thing as VBA, though the two are closely related. A macro is the recorded or written set of instructions. VBA is the language those instructions are written in. When finance professionals talk about running a macro, they are executing a VBA script.
What Does VBA Do? Core Capabilities Explained

So, what does VBA do in practice? It automates repetitive tasks, applies logic across large datasets, creates custom functions, and controls workbook actions that standard Excel formulas cannot handle.
VBA has many uses in financial modeling and is often perceived as an indicator of a financial modeler’s skill set. In some cases, it enables large portfolio management models to incorporate hundreds or even thousands of individual models within a single framework. VBA is also commonly used to address circular references in financial models and can be applied to calculate availability payments in project finance models.
VBA can be used beyond Excel. One common challenge many investment professionals face is that financial model assumptions and scenarios change frequently. Updating investment deck slides in PowerPoint or Word to reflect new figures can take an entire day of work. With the help of VBA, this process can be automated and completed in a matter of seconds.
At its most practical level, VBA automates actions that would otherwise require manual input. But the range of what it can do goes well beyond simple task recording. Here are the core building blocks that make VBA useful in a finance context:
Macros: A macro is a stored sequence of commands that runs on demand. You can record one by clicking Record Macro in the Developer tab, perform your actions, then stop recording. Excel captures every step as VBA code. From that point, the entire sequence runs with a single click or keyboard shortcut.
Subroutines and Functions
| Type | Returns a Value? | Typical Use in Finance |
| Subroutine (Sub) | No | Formatting reports, updating data, triggering actions |
| Function | Yes | Custom calculations, IRR variants, bespoke financial ratios |
Subroutines perform actions. Functions return a result that can be called directly inside an Excel cell, just like a native formula. Finance teams use both, often within the same model.
Loops and Conditionals Loops instruct VBA to repeat an action across a defined range, for example, cycling through every row in a dataset to flag transactions above a threshold. Conditionals (If/Else, Select Case) allow the code to make decisions based on cell values, dates, or user inputs. Together, these two structures handle the bulk of financial automation logic.
Variables and Data Types Variables store values temporarily during code execution. Declaring the correct data type matters for both accuracy and performance:
- Integer / Long: whole numbers, row counters
- Double: decimal figures, financial calculations
- String: text values, ticker symbols, account names
- Boolean: true/false flags for conditional logic
- Date: timestamps, period-end dates
User-Defined Functions (UDFs) UDFs are custom formulas built in VBA and used directly in Excel cells. A person can build a UDF that calculates a weighted average cost of capital using firm-specific inputs, or one that applies a non-standard discounting convention. Once written, a UDF behaves exactly like a native Excel function and can be reused across the workbook.
How to Get Started with VBA in Excel
The learning curve for VBA is more manageable than most finance professionals expect, particularly if you already work in Excel daily. The logic of VBA mirrors the logic of financial modeling: structured inputs, defined processes, predictable outputs.
Here are the practical first steps:
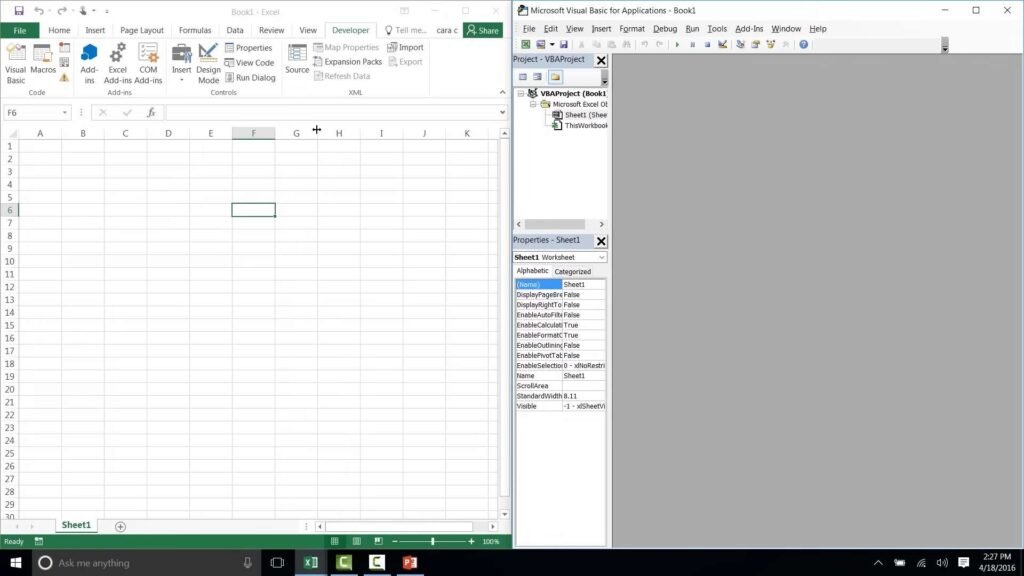
Step 1: Enable the Developer Tab: Go to File > Options > Customize Ribbon and check the Developer box. This unlocks the macro recording tools and direct access to the VBA Editor from the Excel ribbon.
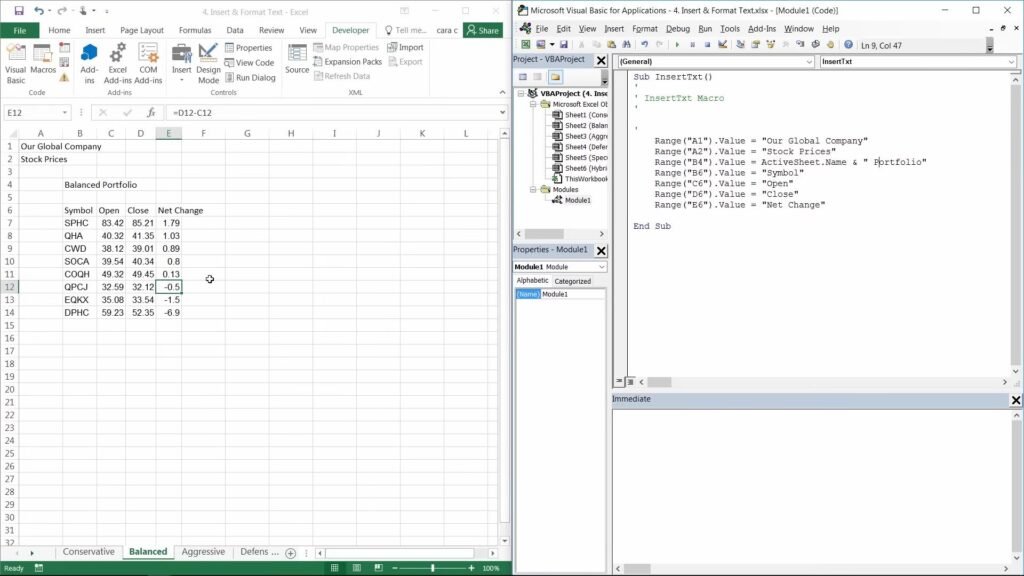
Step 2: Record a Simple Macro: Use the Record Macro function to capture a basic task, such as formatting a table or copying a range. Then open the generated code in the VBA Editor and read through it. This is the fastest way to connect actions you already understand with the VBA syntax that drives them.
Step 3: Open the VBA Editor: Click on the Macro button, select the macro you have created, and instead of running it, click Step Into. This will take you to the VBA Editor, where you can view the code generated by the recorded macro and make edits if needed (this requires some understanding of VBA). In the VBA Editor, you can modify the recorded macro to perform slightly different tasks, for example, changing a range reference, adding a loop, or introducing a conditional statement. Making incremental modifications helps build fluency more quickly than starting with a blank code window.
Step 4: Progress to Subroutines and UDFs: Once you are comfortable and understand VBA coding, write your first subroutine from scratch, then your first user-defined function. Apply both to a real task from your current workflow. Practical application is what converts knowledge into skill.
The jump from basic macro recording to writing functional VBA for financial models typically takes weeks with consistent practice, not months. Structured training accelerates that timeline considerably.
Why Finance Teams Use VBA
Excel is the default modeling environment across investment banking, private equity, FP&A, and corporate finance. However, Excel alone has its limits. As models grow in size and complexity, or when teams need to test multiple scenarios, tasks that might otherwise take an entire day can often be completed in minutes.
VBA enables finance professionals to work more efficiently, significantly reducing the time required for repetitive or complex tasks. It is also a key differentiator between beginners and more advanced practitioners.
Automating Repetitive Financial Tasks
The most immediate value VBA delivers is time recovery. Tasks that analysts perform on a daily or weekly cycle, and that follow the same logical steps each time, are strong candidates for automation.
Common examples include:
- Updating a monthly P&L by pulling in new actuals and reformatting the output
- Extracting financial data from multiple source files and consolidating it into a single sheet
- Applying consistent formatting and validation rules across large datasets
- Generating a standardized report package with a single button click
A finance analyst who spends few hours every day on a data consolidation tasks that can be reduced to under five minutes with a well-written macro. Multiplied across a team, the productivity gain is significant.
Building Dynamic Financial Models
Static models require manual intervention every time an assumption changes. VBA removes that dependency by making models responsive to new inputs automatically.
In practice, this means:
- Scenario and sensitivity analysis that runs across dozens of variable combinations without manual re-entry
- Automatically updating the investment deck on PowerPoint based on a new financial model scenarios.
This is where VBA moves from a convenience tool to a genuine modeling asset. A private equity analyst running 50 leverage scenarios manually would take most of the day. A VBA-driven model cycles through all 50 in seconds and outputs a clean summary table.
Generating Reports Automatically
Financial reporting involves pulling data from multiple sources, applying calculations, formatting outputs, and distributing the final product. Each of those steps is automatable with VBA.
Finance teams use VBA to:
- Consolidate data from multiple worksheets or external files into a single reporting template
- Apply consistent formatting, headers, and branding automatically
- Generate variance reports that highlight budget versus actual differences
- Export formatted reports to PDF or distribute them via Outlook directly from Excel
The accuracy benefit is as important as the time saving. Every manual step in a reporting process is a potential error. Automating the process removes that risk entirely.
Ready to apply VBA in real financial models? FMU’s VBA for Financial Models course teaches you how practitioners at top investment banks and private equity firms build, automate, and stress-test models using VBA. Hands-on, deal-tested, and built for finance professionals. Explore the Course →
VBA vs. Other Automation Tools: Where It Still Wins
With Power Query, Python, and Power Automate gaining visibility in finance workflows, a fair question is whether VBA is still worth learning. The answer depends on what you are trying to do. Each tool has a distinct strength, and understanding where they overlap and where they diverge helps finance professionals make the right choice for each task.
| Tool | Best For | Limitations vs. VBA |
| VBA | Finance and Investment professional, model logic, and report generation | Less suited for large advance automation |
| Power Query | Data transformation and cleaning at scale | Cannot manipulate workbook objects or trigger actions |
| Python | Advanced statistics, machine learning, large datasets | Requires separate setup, not native to Excel |
| Power Automate | Cloud-based workflow automation across Microsoft 365 | Limited direct control over Excel model logic |
The case for VBA comes down to four practical advantages that the alternatives have not displaced:
It runs natively inside Excel. No installation, no IT approval, no dependencies. Every analyst with Excel already has access to a fully functional VBA environment.
It works offline. Power Automate and cloud-based tools require connectivity. VBA runs entirely within the local workbook, which matters in deal environments where data stays off the network.
It controls every element of a workbook. VBA can read and write to cells, manipulate sheets, trigger events, build userforms, and interact with charts. Power Query transforms data but cannot drive model behavior the way VBA can.
It remains the standard at top institutions. Investment banks, private equity firms, and large corporates have built years of model infrastructure in VBA. Knowing VBA means being able to work with, audit, and improve those existing models from day one.
Python is often used for statistical analysis at scale. Power Query is cleaner for data transformation pipelines. But for automating financial models inside Excel, VBA has no direct equivalent
Conclusion
VBA is not a relic. It is a practical, battle-tested tool that finance professionals use to automate models, eliminate reporting errors, and reclaim time for analysis that actually drives decisions. Newer tools have their place, but none replicate what VBA does inside a live financial model. For anyone serious about financial modeling, VBA proficiency is not a bonus skill. It is an expected one.
Take the next step. FMU’s VBA for Financial Models course covers everything from foundational syntax to automating complex LBO and DCF models. Currently available at $210. Start Learning VBA