

An elite equity research report isn’t a summary of a 10-K. It is a model-driven narrative where every qualitative claim is anchored in quantitative evidence. Most aspiring analysts drown in the hundreds of pages of a 10-Q, struggling to separate market noise from the signals that actually drive alpha. You likely find it difficult to link your financial models to a written narrative, leaving your price target feeling like a shot in the dark rather than a calculated conviction. This equity research report tutorial provides the exact workflow used by elite analysts to transform raw data into institutional-grade insights.
Mastering this skill is the fastest way to differentiate yourself in a competitive hiring market. With CFRA projecting a 13.5% increase in S&P 500 earnings for 2026, the ability to identify high-quality growth through fundamental analysis is more valuable than ever. We’ll show you how to formulate a unique investment thesis, structure your report for maximum impact, and justify your valuation using a professional DCF model. It’s time to stop guessing and start producing research that commands respect from senior portfolio managers and hiring teams alike. Master financial modeling like the pros by following this structured blueprint for success.
- Learn to extract actionable insights from 10-Ks and earnings calls using a proven institutional workflow that separates market noise from alpha.
- Follow this equity research report tutorial to build a robust 3-statement model and DCF valuation that establishes a defensible, professional price target.
- Master the anatomy of a winning report by structuring high-impact cover pages and the 30-second investment summary used by elite analysts.
- Bridge the gap between technical Excel data and professional narrative by selecting only the most relevant metrics to support your investment thesis.
- Implement a “Red Team” review process and leverage modern AI tools to ensure technical integrity and produce reports that impress hiring managers.
The Fundamentals of Professional Equity Research
An equity research report is the definitive document used to evaluate a company’s financial health, competitive positioning, and future growth prospects. It isn’t a mere collection of facts or a summary of recent news. Instead, it’s a sophisticated argument designed to answer one question: what is this business actually worth? To understand What is Equity Research? at an institutional level, you must view the report as a model-driven narrative. The core objective is to provide a “Buy,” “Hold,” or “Sell” recommendation, backed by a specific, mathematically derived price target. This equity research report tutorial focuses on the rigorous standards required by top-tier firms to reach that conclusion.
Analysts generally operate in two distinct environments. Sell-side analysts work for investment banks, publishing research to help institutional clients make informed trading decisions. Their work is often public and serves as a primary source of market sentiment. Buy-side analysts work for asset managers or hedge funds. Their reports are internal and proprietary, directly influencing the firm’s capital allocation. Regardless of the side, the report serves as your professional calling card. It’s the tangible proof of your ability to synthesize complex data into a clear investment thesis.
The Purpose of Equity Research in 2026
In 2026, the role of the analyst has shifted from news aggregation to deep insight generation. With AI-powered platforms now handling basic data extraction at costs ranging from $16 to $100 per month, humans must provide the “so what” that algorithms miss. Your report facilitates price discovery and market efficiency by identifying mispriced assets. Institutional investors don’t read your report to find the current P/E ratio; they read it to validate their internal models against your unique primary research and sector expertise.
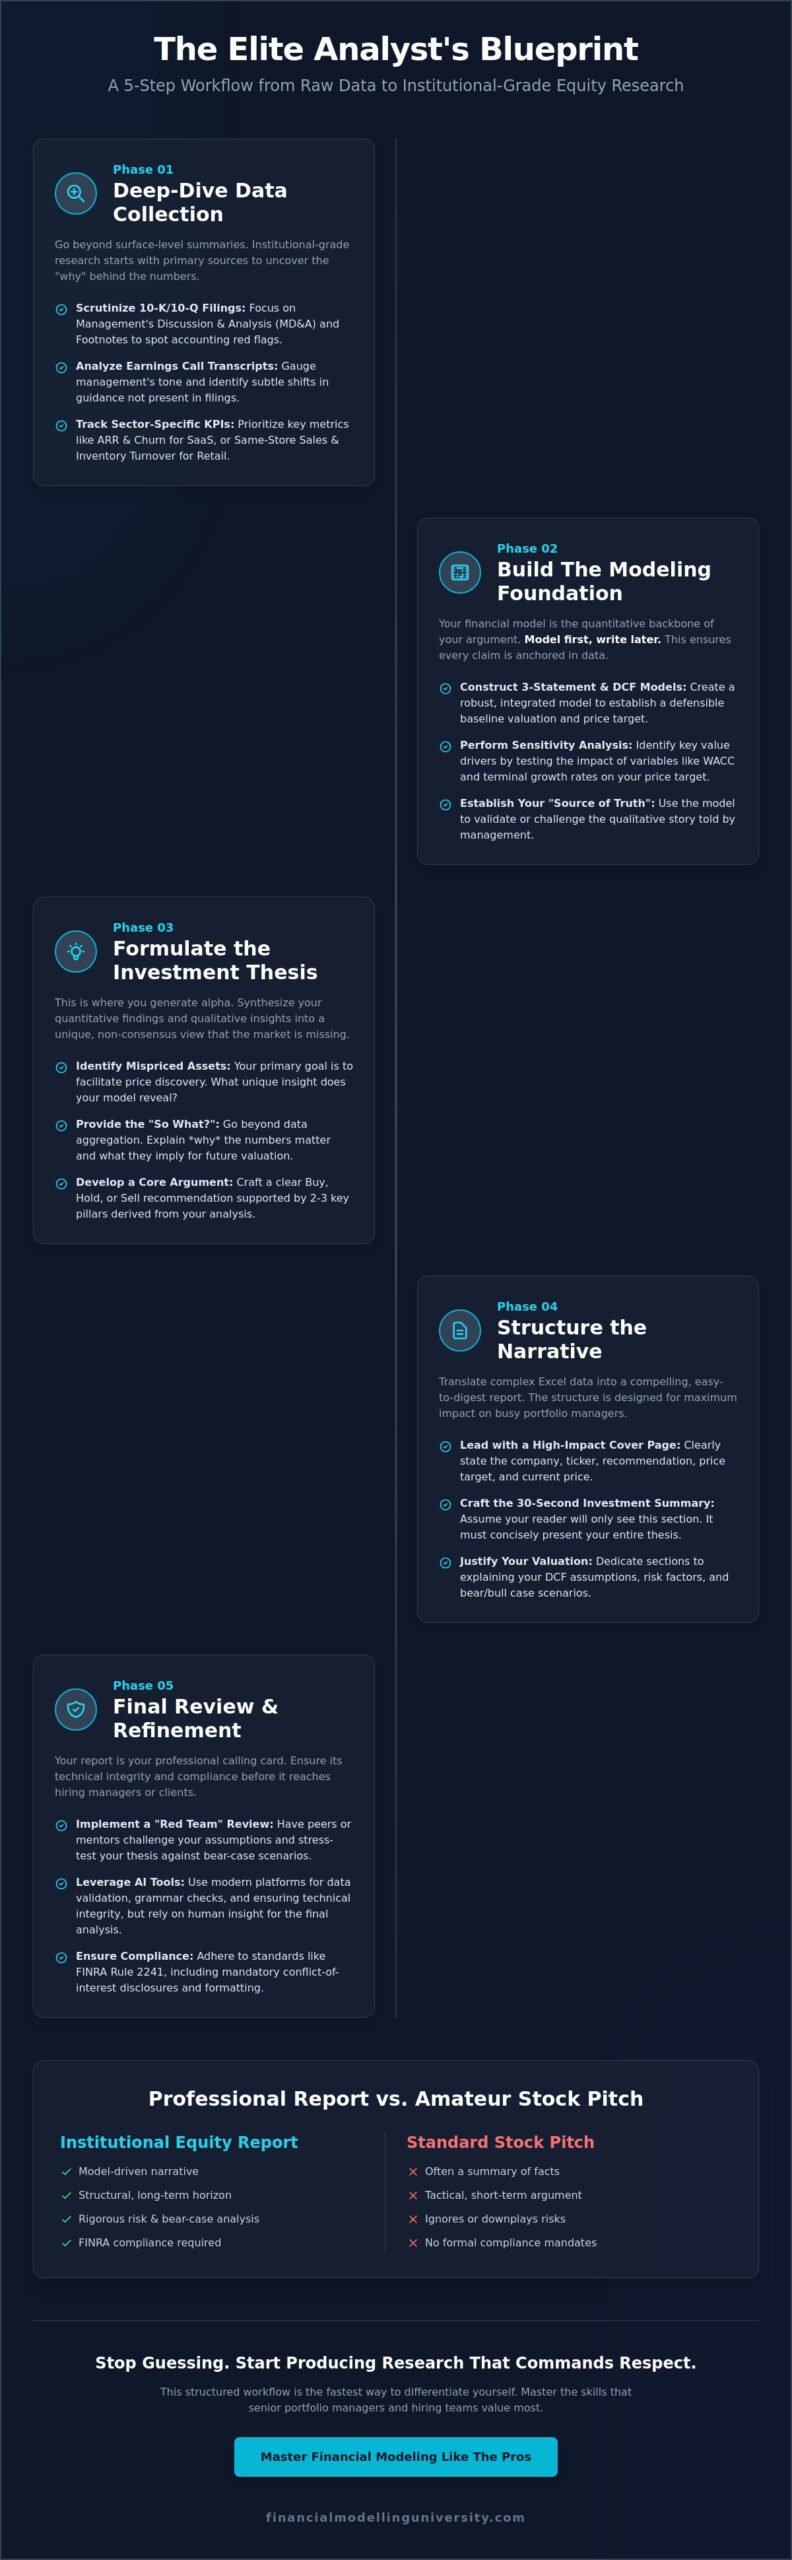
ER Report vs. Stock Pitch: Key Differences
Don’t confuse a professional report with a standard stock pitch. While a pitch is often a tactical, short-term argument, an institutional report focuses on a structural, long-term investment horizon. Professional standards require a level of depth that many retail pitches ignore. This includes a rigorous risk section where you must “stress test” your own thesis against bear-case scenarios. Compliance is another major differentiator. Under FINRA Rule 2241, institutional reports must adhere to strict conflict-of-interest disclosures and formatting mandates. This equity research report tutorial ensures your work meets these high-stakes requirements, moving you beyond amateur analysis into the realm of elite practitioners.
The 5-Step Workflow: From Raw Data to Investment Thesis
Professional analysts don’t start with a blank Word document. They begin with a rigorous, data-driven order of operations designed to eliminate bias and uncover mispriced securities. This equity research report tutorial breaks down the institutional workflow into five manageable stages. By following this sequence, you ensure that your final recommendation isn’t just an opinion; it’s a defensible conclusion derived from exhaustive technical analysis.
Phase 1: Deep-Dive Data Collection
Institutional-grade research starts with the 10-K and 10-Q. However, elite analysts don’t read these documents linearly. They focus on the Management Discussion and Analysis (MD&A) to understand the “why” behind the numbers and scrutinize the Footnotes to identify potential accounting red flags or off-balance sheet liabilities. Beyond filings, you must utilize earnings call transcripts to gauge management’s tone and identify subtle shifts in guidance. Successful research also requires tracking sector-specific KPIs. For a SaaS company, you’ll prioritize Annual Recurring Revenue (ARR) and Net Churn; for retail, same-store sales and inventory turnover are your primary metrics. Gathering this raw data is the first step in building a narrative that stands up to buy-side scrutiny.
Phase 2: The Modeling Foundation
You must finish your financial model before writing a single sentence of your report. The model is your source of truth. It allows you to see if the qualitative story management tells actually aligns with the quantitative reality. Building a robust 3-statement model and DCF is essential for establishing a baseline valuation. During this phase, perform a sensitivity analysis to determine which variables, such as terminal growth rates or WACC, have the most significant impact on your price target. This process is deeply rooted in investment banking financial modeling principles, where precision and logical structure are paramount. If you want to master these technical skills, exploring our specialized courses can accelerate your path to professional proficiency.
Synthesizing the Thesis
Once the model is built, you must benchmark your findings using Comparable Company Analysis (Comps). This verifies if your DCF-derived value is realistic relative to the broader market. From there, identify the two or three “value drivers” that will actually move the stock. These are the structural shifts or catalysts that the market is currently underestimating. As highlighted in this Forbes on writing a buy-side report, the goal is to create a logical bridge between historical performance and future projections. The final step is drafting the report, where you synthesize your model and narrative into a cohesive, persuasive document that provides a clear path to alpha.
Anatomy of a Winning Report: Essential Sections
Institutional reports follow a rigid, standardized architecture designed for rapid consumption by busy portfolio managers. A professional report isn’t a long-form essay; it’s a structured intelligence briefing. Every page must serve a specific purpose, moving the reader from the high-level recommendation to the granular technical details. This equity research report tutorial focuses on the five essential sections that comprise an institutional-grade document. Your goal is to provide immediate clarity on the “Rating,” “Price Target,” and the “Upside/Downside” potential before the reader even turns the first page.
The cover page functions as your executive summary. It must display the company name, ticker, and current price alongside your rating and 12-month price target. Include a “Snapshot” table showing 3-5 years of historical and projected financials, specifically focusing on Revenue, EBITDA, and EPS. This allows a PM to see the trajectory of the business at a glance. Following this, the Business Description and Industry Overview should contextualize the company’s competitive moat, explaining why this specific firm will outperform its peers in the current macro environment.
The Investment Summary: Hooking the Reader
The Investment Summary is the most critical section of your report. Use the “Three Pillar” approach to structure your argument. Identify the three core reasons why the market is wrong about this stock. These pillars might include an underappreciated product cycle, a structural margin expansion, or a mispriced capital allocation strategy. Write a single, punchy sentence that defines your price target justification. Finally, follow the “Golden Chart” rule. Every elite report has one chart, usually a visualization of a key value driver, that tells the entire story. If your summary doesn’t convince a reader in 30 seconds, they won’t read the rest of your 25-page analysis.
Valuation & Price Target Justification
This is where your financial model meets the page. You must integrate your DCF valuation outputs with Comps-based multiples to provide a balanced view. Don’t just state your price target; explain the WACC and Terminal Value assumptions that got you there. Professional analysts often provide a “Target Price Range” rather than a single number to account for different market conditions. This adds credibility to your thesis by acknowledging the inherent uncertainty in long-term projections. Conclude this section with a rigorous Investment Risks analysis. You must present a balanced Bear Case, detailing exactly what could go wrong and how it would impact your valuation. This level of transparency is what separates professional research from amateur stock picking.
Connecting the Narrative: Translating Excel into English
A flawless financial model is useless if you can’t articulate the “why” behind the numbers. Many junior analysts fall into the trap of the “data dump,” listing every metric without providing context. This equity research report tutorial emphasizes the transition from quantitative modeling to qualitative persuasion. You must create “The Bridge” by linking historical performance to your future projections. If revenue grew at 10% historically, don’t just project 12% because you’re bullish. Explain the causality. Is it driven by market share gains, price increases, or a new product cycle? This narrative clarity is what institutional investors demand.
Maintaining an authoritative tone requires using “analyst speak” effectively. Use precise terminology like “operating leverage,” “incremental margins,” and “free cash flow conversion.” Avoid vague qualifiers like “very” or “significant.” Instead, quantify your claims. If a company’s competitive position is improving, cite the specific basis point expansion in market share or the reduction in customer acquisition costs. Your goal is to sound like an industry insider who has lived the data, not a student summarizing a textbook.
The Art of the Financial Narrative
Your writing must move beyond correlation to prove causality. Don’t simply state that revenue increased. Instead, decompose that growth into its price and volume components. This level of detail shows you understand the underlying business drivers. Use margin analysis to demonstrate operational leverage. If EBITDA margins are expanding faster than top-line growth, explain how the company is scaling its fixed costs. Finally, connect capital expenditure (CapEx) directly to your future growth rates. If management is ramping up investment in AI data centers, as seen in the 2026 investment themes, your model must reflect the anticipated return on that invested capital.
Best Practices for Financial Charting
Visual storytelling is where your analysis becomes digestible. Professional-grade charts in Excel for Finance should follow an institutional style guide. This means standardizing fonts, removing unnecessary gridlines, and using a consistent color palette. Follow the “One Chart, One Message” rule. If a chart requires a paragraph of explanation, it’s too complex. Ensure all visuals are live-linked to your model. Version errors are a career-killer in high-stakes finance; live-linking ensures your charts update automatically as your assumptions change. To master these elite presentation techniques, consider enrolling in our Excel for Finance Course today.
Final Review and Career Implementation
The final stage of this equity research report tutorial involves a rigorous “Red Team” review. You must act as your own worst critic. Identify every assumption in your model and attempt to break it. If your thesis relies on a 2.6% US GDP growth rate in 2026, as projected by Goldman Sachs, what happens if that number slips to 1.5%? This stress-testing ensures your price target remains defensible under pressure. In 2026, elite analysts also leverage AI-powered platforms for grammar and formatting. While these tools cost between $16 and $100 per month for individual users, they should only be used to polish the narrative. Never allow an algorithm to replace the core fundamental analysis that defines your professional value.
Building a portfolio of these reports is the only way to demonstrate the consistency required by institutional firms. A single great report might be luck; five great reports are proof of a repeatable process. As you move from drafting to publishing, remember that your reputation is built on the integrity of your data. SEC examination priorities in 2026 continue to focus on data integrity and the management of conflicts of interest. Adhering to these high standards now prepares you for the regulatory environment of professional finance.
The Analyst Checklist
Internal consistency is non-negotiable. Ensure that the summary figures on your cover page align perfectly with your valuation tables and the raw data from SEC filings. Verify your citations from sources like the Bloomberg Terminal, which currently costs approximately $31,980 per year, or FactSet. Remove subjective language such as “I believe” or “I feel.” Replace these with declarative statements backed by data. For example, instead of saying you believe margins will expand, state that operational leverage will drive a specific basis point improvement based on your cost structure analysis. This discipline mirrors the precision required for FINRA Series 86 and 87 compliance.
Building Your Professional Brand
Your completed report is a powerful asset for career transformation. Don’t let it sit on your hard drive. Share your insights on LinkedIn and specialized finance forums to build a track record of public conviction. When you’re in an interview, use the report to guide the conversation. Walk the Portfolio Manager through your “Three Pillars” and be prepared for the Q&A phase. They will likely target your Bear Case first. Successfully defending your thesis demonstrates the maturity and technical rigor required for top-tier roles. To further validate your expertise, consider earning a financial modeling certification. This provides the quantitative proof of your ability to perform at an institutional level, turning a single tutorial into a lifelong professional advantage.
Elevate Your Professional Research Standards
Success in high-stakes finance isn’t about having the most data; it’s about having the most defensible narrative. This equity research report tutorial has provided the blueprint for bridging the gap between complex Excel models and persuasive institutional writing. You now understand how to structure a report for rapid consumption, justify a price target using rigorous DCF analysis, and pressure-test your own assumptions through a Red Team review. The transition from an aspiring analyst to an industry expert requires moving beyond theory into disciplined, real-world application.
The path to professional mastery is structured and logical. Don’t leave your career transformation to chance. Join a community trusted by 25,000+ finance professionals and gain access to institutional-grade Excel templates and direct mentorship from industry experts. Your journey toward performing at an elite level starts with the right curriculum. Master Financial Modeling Like the Pros with FMU All-Access. You have the technical blueprint and the workflow. Now, it’s time to execute with precision and secure your place among the industry’s elite practitioners.
Frequently Asked Questions
What is the ideal length for an equity research report?
Institutional initiating coverage reports typically range from 15 to 25 pages. While update notes are much shorter, often 2 to 5 pages, your first professional report must be comprehensive. Focus on the quality of your insights rather than page count. A concise, 15-page report with a robust equity research report tutorial structure is more valuable than a 40-page document filled with irrelevant market noise.
Do I need a Bloomberg Terminal to write a professional report?
You don’t need a Bloomberg Terminal to produce institutional-grade research. While it remains the industry standard with a subscription cost of approximately $31,980 per year in 2026, most data is accessible elsewhere. Use SEC EDGAR for filings, company investor relations pages for transcripts, and specialized AI platforms. Your ability to synthesize data is more important to hiring managers than the software you used to find it.
How do I choose which company to write my first report on?
Select a mid-cap or large-cap company in a sector you already understand. Avoid micro-caps or highly speculative “story stocks” that lack sufficient public data. Choosing a company with at least three direct public competitors allows you to build a meaningful Comps table. This ensures your first equity research report tutorial exercise focuses on fundamental analysis rather than struggling to find basic financial information.
What is the difference between an equity research report and a stock pitch?
An equity research report is an exhaustive institutional document, while a stock pitch is a tactical, high-level summary. Reports require a full 3-statement model, a DCF valuation, and detailed regulatory disclosures. A pitch often focuses on a single catalyst. In contrast, the report provides a structural analysis of the company’s long-term competitive moat and financial health, serving as a definitive professional calling card.
How much emphasis should I put on the DCF vs. Comparable Company Analysis?
Balance both methods equally to provide a credible valuation range. The DCF establishes intrinsic value based on projected cash flows, while Comps provide a market-based reality check. Elite analysts use a “football field” chart to show where these valuations overlap. If your DCF price target is significantly higher than what the market multiples suggest, you must provide a rigorous technical justification for that premium.
Can I use AI to help write my equity research report in 2026?
Use AI tools for data extraction and formatting, but never for the investment thesis itself. AI platforms currently cost between $16 and $100 per month for individual users and are excellent for summarizing long earnings call transcripts. However, the core financial logic and “The Bridge” between your model and narrative must be your own work. Technical integrity is the foundation of your professional reputation.
What are the most common mistakes junior analysts make in their reports?
The most frequent errors are the “data dump” and failing to prove causality. Junior analysts often list historical metrics without explaining the price or volume drivers behind them. Another common mistake is projecting aggressive revenue growth without a corresponding increase in CapEx or R&D in the model. Ensure every qualitative claim in your narrative is directly supported by a quantitative change in your Excel model.
How do I handle a company that has no direct competitors for my Comps table?
Identify “proxy” competitors that share similar business models, margin profiles, or end-market exposures. If a company is truly unique, look for peers that compete for the same investor capital within the broader sector. You don’t need a perfect match; you need a logical peer group. Clearly explain your selection criteria in the valuation section to maintain transparency and credibility with your readers.