


Your valuation is only as defensible as your risk assumptions. If you’re simply pulling a raw Beta from Bloomberg and plugging it into your WACC, you’re likely mispricing risk and losing credibility with your VP. It’s a common frustration in elite finance. Between inconsistent tax rate applications and the struggle to find truly comparable peer groups, the process of unlevering and relevering beta often feels more like guesswork than science. You know that capital structure shouldn’t distort the underlying business risk, yet the math often gets messy when you’re moving between different leverage profiles.
This FMU guide provides the rigorous, institutional-grade framework you need to strip away financial leverage and isolate pure operational risk. Trusted by 25,000+ finance professionals, our curriculum helps you master the Hamada Equation and justify every basis point of your cost of equity with the precision expected at a top-tier firm. We will break down the exact steps for selecting peer groups, applying the 21% corporate tax rate, and implementing these formulas in Excel using modern AI-enhanced workflows. To master financial modeling like the pros and learn more, explore all available Courses.
In institutional finance, the number you pull from a terminal is almost never the number you use in your model. Levered Beta, often called Equity Beta, reflects the total risk an equity investor assumes as defined in the broader context of Beta (finance). This includes both the inherent volatility of the business operations and the added risk of the company’s specific debt load. Conversely, Unlevered Beta, or Asset Beta, isolates the pure operational risk. It represents what the risk profile would look like if the firm had zero debt in its capital structure.
Peer groups are rarely capital-structure neutral. One peer might be a cash-rich tech giant with zero debt, while another is a highly geared legacy player. Their equity betas will diverge wildly, even if they sell the exact same product. This “noise” makes direct comparison impossible. To find a “pure-play” industry risk, you must strip away these capital structure differences. This rigorous process of unlevering and relevering beta allows an analyst to compare apples to apples across a diverse set of comparable companies.
Business risk is the baseline. It’s driven by industry dynamics, competitive positioning, and the ratio of fixed to variable costs. Financial risk is an overlay. It’s the additional volatility introduced by interest obligations and the contractual nature of debt. When a company takes on leverage, it magnifies the returns and the risks for equity holders. This is why two companies in the same sector can have identical asset risks but vastly different equity betas; the more debt a firm carries, the higher its levered beta will climb.
Professional valuation requires a defensible cost of capital. In a DCF model, you don’t use a company’s current beta if it’s undergoing a recapitalization or if you’re valuing a private entity with no public stock. Analysts use a peer group to derive an average unlevered beta, which serves as a proxy for the industry’s fundamental risk. You then relever this figure to the target capital structure of your subject company. This ensures your WACC reflects the forward-looking risk profile rather than historical artifacts. By applying the current 2026 U.S. corporate tax rate of 21% consistently across the peer group, you eliminate tax-shield distortions. Mastering this recalibration is critical for presenting a robust case to an investment committee or a VP who demands precision. To learn more, explore all available Courses.
Execute the stripping of financial leverage with surgical precision. The Unlevered Beta (βu) formula is your primary tool: βu = βl / [1 + ((1 – T) * (D/E))]. This calculation removes the volatility added by a company’s debt obligations, leaving you with the pure asset risk. For institutional accuracy, calculate the Debt-to-Equity (D/E) ratio using the current market value of equity (Market Cap) rather than book value. While some analysts debate using Total Debt, the industry standard for unlevering and relevering beta typically favors Net Debt to account for cash balances that offset interest-bearing liabilities.
Don’t settle for a generic list of competitors. Institutional-grade comps require strict filtering by sector, market capitalization, and geographic exposure. A “pure-play” method ensures that the companies in your set share the same fundamental business risks. When reviewing your data, discard outliers with distressed capital structures or negative equity, as these skew the results. Use the median Unlevered Beta of the group rather than the mean to minimize the impact of statistical noise. For a deeper academic dive into these variables, consult NYU Stern on Beta Determinants.
The tax shield is a critical component of the formula. Because interest is tax-deductible, debt is less risky for the firm than it appears on the surface. In 2026, the U.S. federal corporate income tax rate remains a flat 21%, a stability reinforced by the 2025 “One Big Beautiful Bill Act” (OBBBA). Use this marginal rate for domestic valuations rather than the effective tax rate found in annual reports, as the marginal rate better reflects the tax impact of incremental debt. Mastering these technical nuances is a core component of Excel for Finance training.
Precision in these inputs is what separates a student from a professional. If you want to build models that withstand the scrutiny of an investment committee, your data sourcing must be impeccable. To learn more, explore all available Courses.
Once you’ve isolated the pure operational risk of a peer group, you must reintroduce the financial risk specific to your subject company. This is where the process of unlevering and relevering beta reaches its critical conclusion. Relevering isn’t just the mathematical reverse of unlevering; it’s a strategic recalibration. You apply the Hamada Equation: βl = βu * [1 + ((1 – T) * (D/E))]. This formula links the Modigliani-Miller theorem to the Capital Asset Pricing Model (CAPM) by quantifying how much systematic risk increases as a firm adds debt to its balance sheet.
In the current 2026 interest rate environment, with the 10-year U.S. Treasury yield hovering around 4.98%, the cost of debt has risen significantly compared to the last decade. This makes the tax shield calculation even more vital for your valuation. While the 21% corporate tax rate provides a predictable shield, the rising risk-free rate means the “optimal” capital structure is shifting for many firms. Analysts must justify why a specific D/E ratio is sustainable in a high-rate world to maintain a defensible Cost of Equity.
Professional models relever to the target capital structure rather than the current one. If a company is currently over-leveraged compared to its long-term goals, using current debt levels will artificially inflate your Beta and lead to an inaccurate WACC. Analysts typically derive this target from management guidance or industry-wide averages. This distinction is paramount in Private Equity Financial Modeling, where the capital structure evolves rapidly over the investment horizon. Using a static, current D/E ratio in an LBO context would result in a flawed valuation that fails to account for planned deleveraging.
Small shifts in the D/E ratio create significant swings in the final Beta. For instance, a 10% increase in leverage doesn’t just add interest expense; it expands the equity risk premium required by investors. High-growth firms often relever to lower debt levels to maintain operational flexibility, even if it means a higher weighted average cost of capital. The Hamada Equation serves as the bridge between unlevered risk and levered return. Mastering this sensitivity allows you to defend your valuation against the most rigorous cross-examination from a VP or investment committee. To learn more, explore all available Courses.
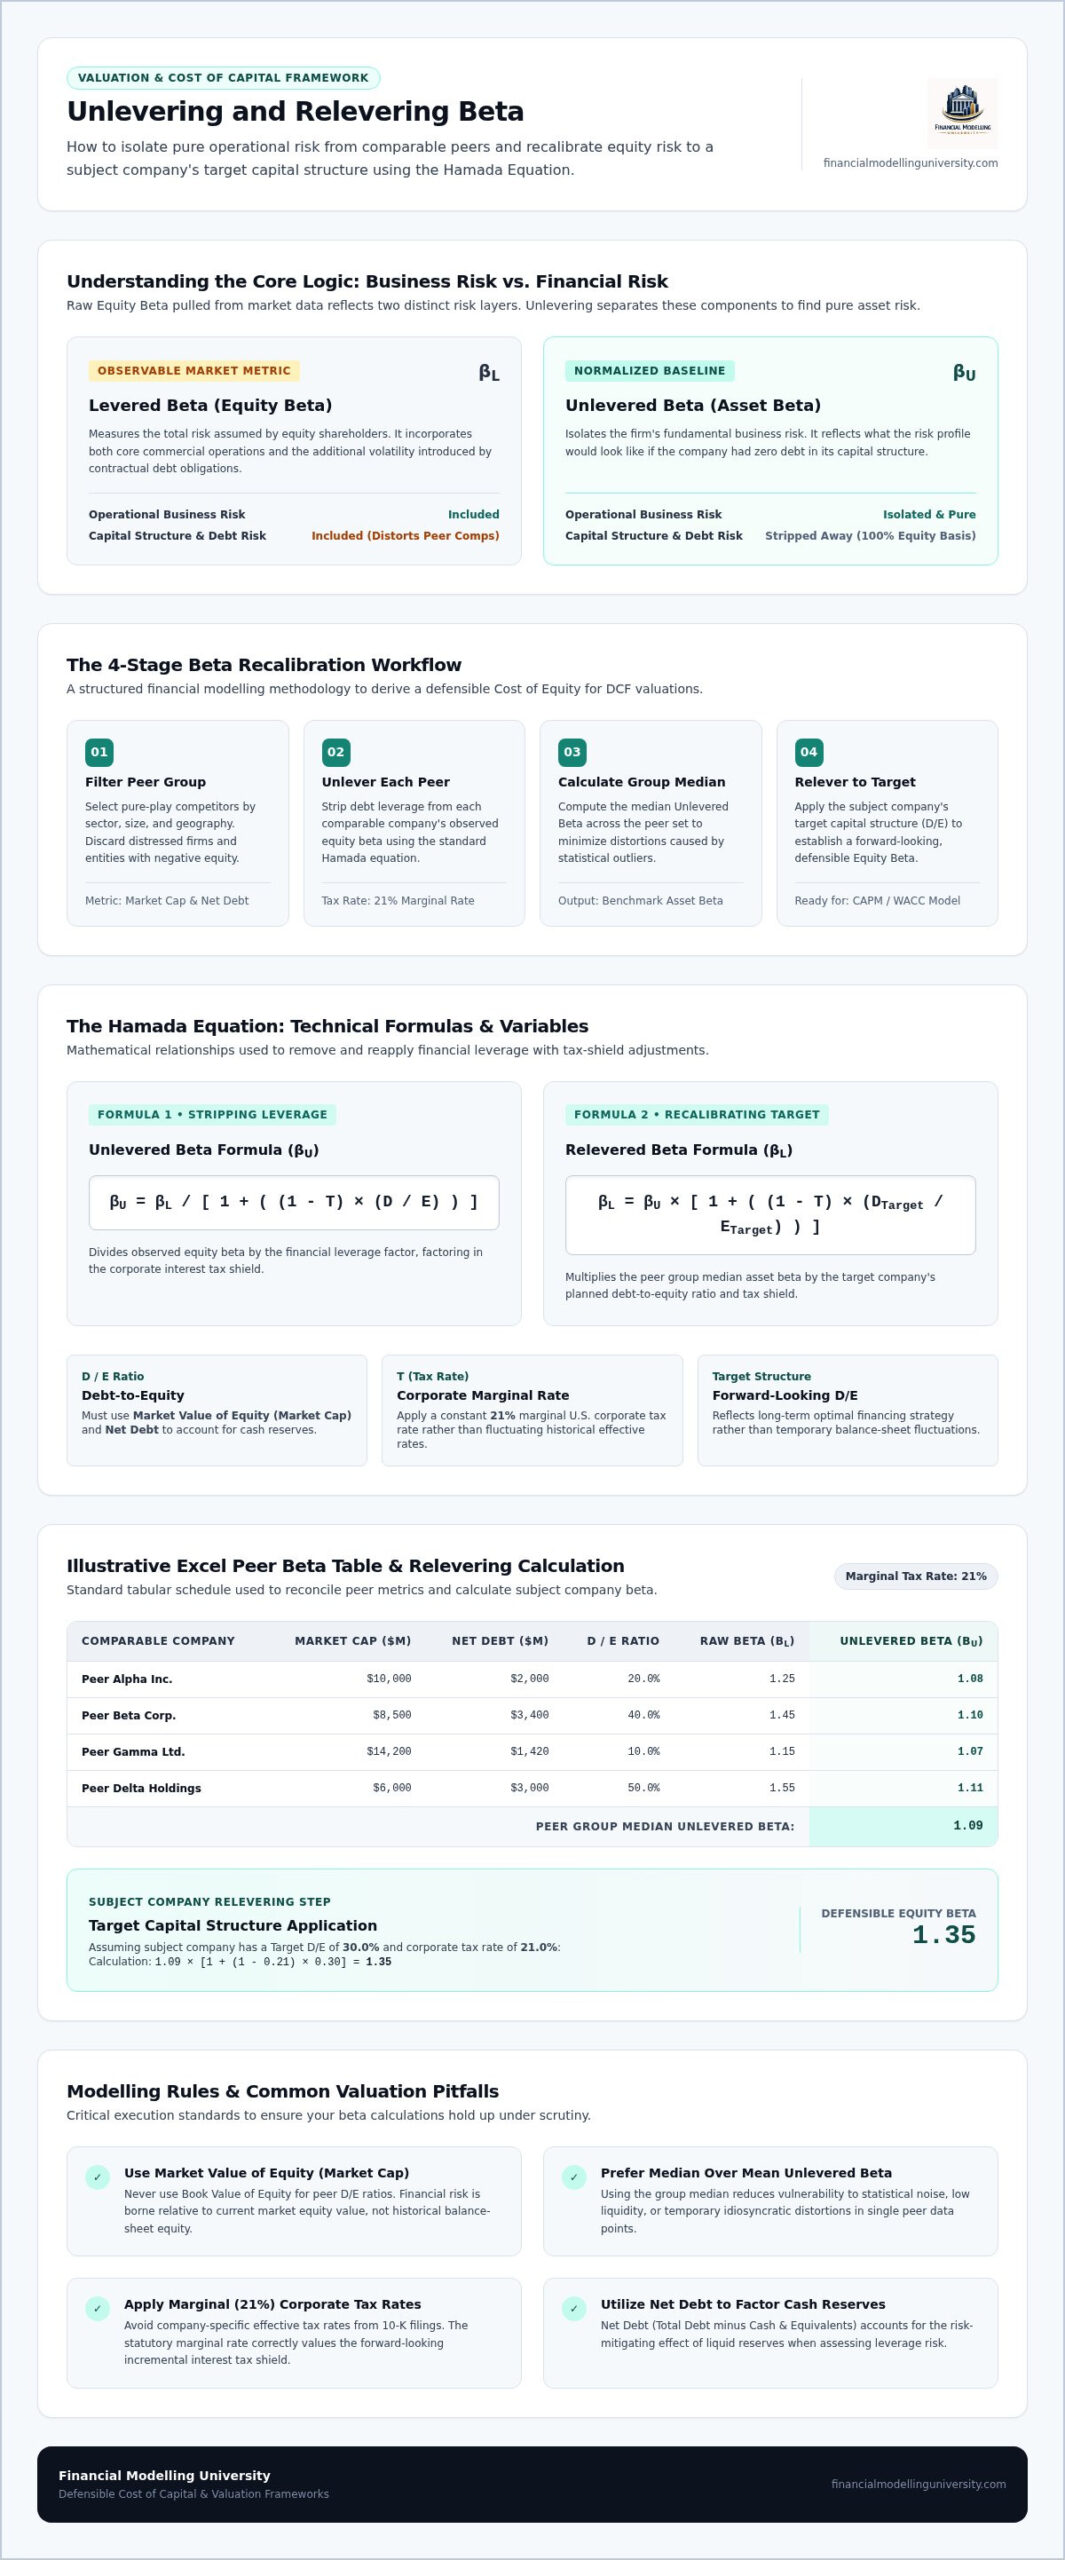
Execution at the elite level requires more than just knowing the formula. It requires avoiding the amateur mistakes that signal a lack of technical depth to a Managing Director. The most egregious error is using the Book Value of Equity in your Debt-to-Equity calculations. Book value is a historical accounting artifact; it doesn’t reflect the current market risk-reward profile. Always use the current Market Capitalization. If you use book values, your D/E ratio will be distorted, leading to a flawed cost of equity that no investment committee will accept.
Consistency is your second priority. Ensure the tax rate used in your unlevering and relevering beta calculation matches the rate in your cash flow projections. In 2026, with the U.S. corporate marginal tax rate stable at 21%, there’s no excuse for discrepancy. Additionally, watch for “cash-rich” companies in your peer group. If a firm has a negative net debt position, its unlevered beta will actually be higher than its levered beta. This isn’t a calculation error. It’s a mathematical reflection that cash acts as a risk buffer for equity holders.
Valuing a private entity requires the proxy method. Since the subject company has no public stock, you must identify a “pure-play” group of public peers to derive an average asset beta. Once you have this baseline, relever it to the private company’s specific target capital structure. Be prepared to defend an illiquidity premium or a “Private Company Discount” to account for the lack of a secondary market. This adjustment typically ranges from 20% to 30%, depending on the size and sector of the business. Mastering these nuances is a hallmark of the Investment Banking Financial Modeling Course.
The high-volatility environment of 2026 demands a rigorous “sanity check.” The standard institutional look-back period is a 5-year monthly beta, which offers a smoother average and filters out short-term market noise. However, in debt-heavy sectors like utilities or real estate, recent interest rate fluctuations might make a 2-year weekly beta more relevant. Compare your final relevered beta to historical industry norms. If your result is an outlier, revisit your peer group selection or your D/E assumptions. Precision in these steps is what separates a professional analyst from a student. To learn more, explore all available Courses.
Your theoretical understanding must translate into a flawless, audit-ready spreadsheet. Building an institutional-grade peer beta table is a mechanical exercise that requires absolute precision and a structured layout. Start by organizing your peer group with tickers, current stock prices, and shares outstanding to calculate live market caps. From there, follow this five-step workflow for unlevering and relevering beta:
Professionalism in modeling is defined by transparency. Adhere to Wall Street standards by color-coding your inputs in blue and your formulas in black. This allows any reviewer, from an associate to a VP, to trace your logic instantly. We use the median rather than the mean because peer groups often contain outliers with skewed leverage profiles that can pull the average away from economic reality. This level of detail is a core focus in our Financial Modeling Course Online, where we emphasize building models that are “audit-proof” for senior leadership.
Don’t stop at a static calculation. Build a dynamic sensitivity table to show how shifts in the debt-to-equity ratio or tax rates impact your final WACC. Use Excel’s “Data Table” feature to stress-test your assumptions across a range of 2026 market scenarios. If you’re using modern financial plugins like Bloomberg or Capital IQ, automate the peer data pulls but always maintain a manual “sanity check” column to verify the integrity of the external data. Your final relevered beta must flow seamlessly into your cost of equity calculation, serving as the foundation for your terminal value. To learn more, explore all available Courses.
Precision in risk assessment is the hallmark of an elite analyst. You now have the blueprint to navigate the complexities of unlevering and relevering beta with institutional-grade accuracy. By isolating pure asset risk and applying target capital structures through the Hamada Equation, you ensure your valuations remain defensible under the most rigorous scrutiny. This isn’t just about plugging numbers into a formula; it’s about building models that provide clarity and transparency in a volatile 2026 market environment.
Performing at the level of elite industry practitioners requires a commitment to academic rigor and practical application. Whether you’re justifying a cost of equity to an investment committee or building a complex DCF for an M&A deal, these recalibration techniques are essential catalysts for your professional advancement. To master institutional-grade valuation techniques and access downloadable Excel templates for peer Beta analysis, you need the mentorship of Wall Street veterans. To learn more, explore all available Courses. Take the next step toward professional mastery and perform at the level of the industry’s top practitioners. Your career transformation starts with disciplined execution.
Analysts unlever beta to isolate a company’s fundamental business risk from its financial risk. In a DCF, you often derive risk assumptions from a peer group. Since every company maintains a different debt level, their raw equity betas aren’t directly comparable. Stripping away the “noise” of capital structure allows you to find a pure industry baseline. This asset beta is then relevered to match the specific target leverage of your subject company.
Equity Beta, or Levered Beta, measures the total risk assumed by shareholders, including both operational volatility and the financial risk of debt. Asset Beta, or Unlevered Beta, represents only the underlying risk of the business operations. When you are unlevering and relevering beta, you are essentially removing the impact of a firm’s specific debt-to-equity ratio to find the risk profile it would have if it were entirely equity-financed.
Institutional standards favor using Net Debt for these calculations. This approach acknowledges that excess cash on the balance sheet acts as a buffer, effectively offsetting interest-bearing liabilities and reducing the firm’s overall financial risk. When you calculate the debt-to-equity ratio, subtract cash and equivalents from total debt. This provides a more accurate reflection of the true financial leverage impacting equity volatility in a modern high-interest environment.
You must use the proxy method because private entities lack a public stock price history. Identify a group of publicly traded “pure-play” peers in the same industry and calculate their median unlevered beta. Relever this figure using the private company’s target debt-to-equity ratio and the 21% marginal tax rate. This process creates a defensible risk measure that reflects the private firm’s specific operational profile and intended capital structure.
Always utilize the marginal corporate tax rate rather than the effective tax rate found in annual reports. For U.S. valuations in 2026, the marginal rate is 21%. The marginal rate is the correct input because it represents the tax shield benefit on the next dollar of interest expense. Effective rates often include historical tax credits or non-recurring items that don’t accurately reflect the forward-looking financial risk of the firm.
Every public company has a levered beta, but for a firm with zero debt, the levered beta is identical to its unlevered beta. In the Hamada Equation, if the debt-to-equity ratio is zero, the multiplier becomes one. This indicates the equity risk consists solely of business risk. However, if the company plans to take on debt, you must relever this beta to account for the additional financial risk introduced by that leverage.
The Hamada Equation is the bridge that links a company’s business risk to its financial risk. It’s important because it allows you to quantify exactly how much systematic risk increases as a firm adds debt. By applying this equation during the process of unlevering and relevering beta, you can adjust peer group data to match your subject company’s target capital structure. This ensures your final WACC calculation is technically rigorous and audit-ready.
Update your peer group and beta calculations quarterly or after major market shifts. In the volatile 2026 environment, with the 10-year Treasury yield near 4.98%, stale data can lead to significant valuation errors. Regular updates ensure your market caps and debt levels reflect current economic reality. Maintaining this discipline is a hallmark of elite industry practitioners. To learn more, explore all available Courses.