

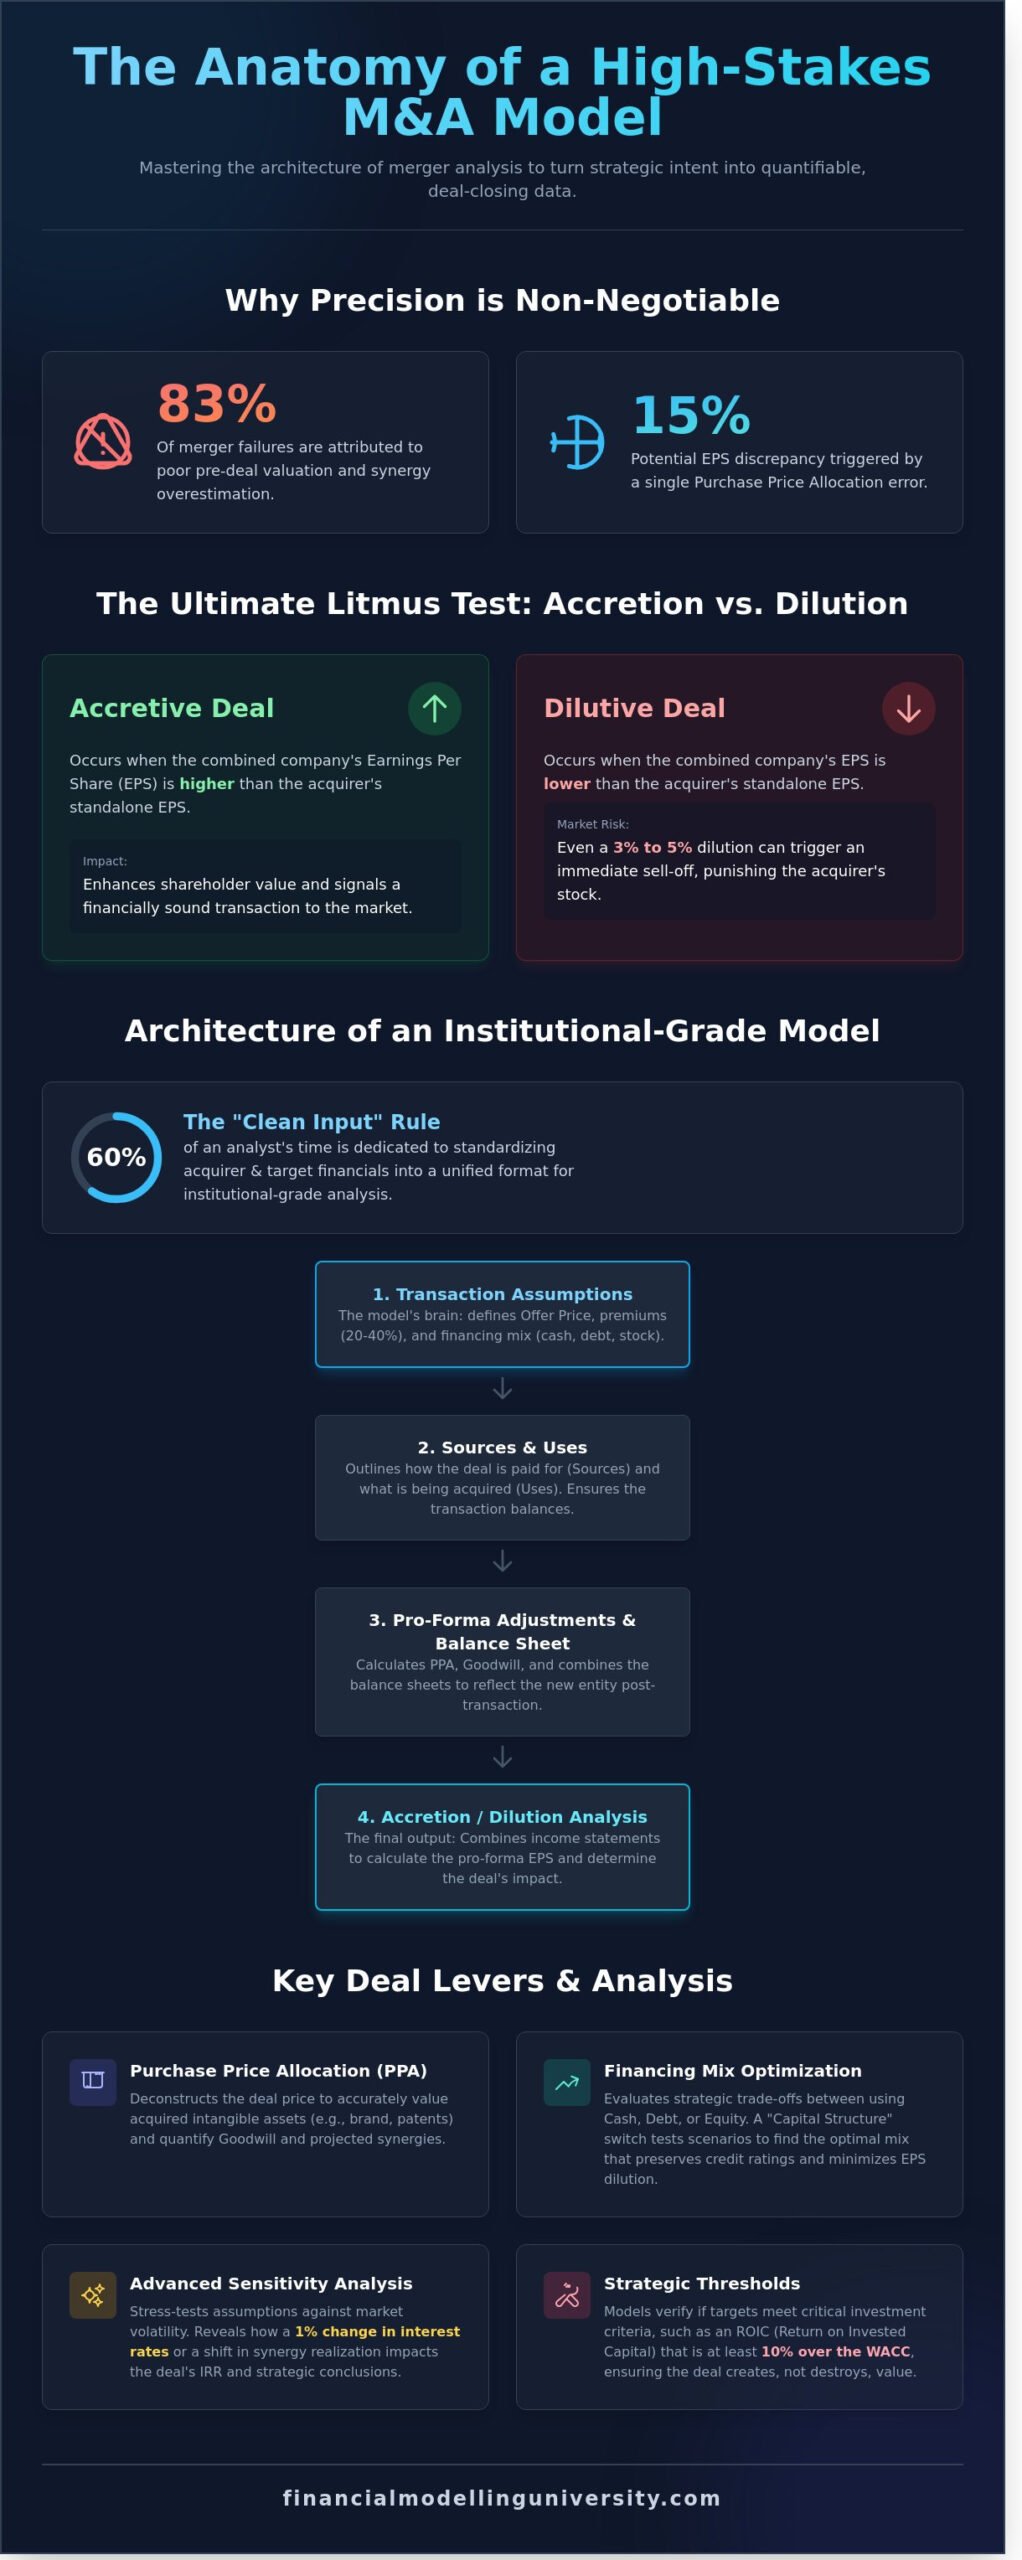
A single error in your Purchase Price Allocation can trigger a 15% discrepancy in projected EPS, turning a strategic victory into a liability before the deal even closes. Most analysts treat m&a modeling as a mechanical data entry task, yet a 2023 study found that 83% of merger failures are attributed to poor pre-deal valuation and synergy overestimation. You’re right to feel the pressure when balancing a complex mix of cash, stock, and debt. It’s the most scrutinized skill in the 2026 finance recruitment cycle, and the margin for error has never been thinner.
We’ll move beyond basic mechanics to master the architecture of high-stakes merger analysis with professional precision. You’ll learn to build an error-free model from scratch, ensuring every synergy and tax shield is accounted for. This guide breaks down the technical granularities of Goodwill, accretion/dilution math, and the strategic “why” behind every number. By the end, you’ll possess the technical mastery required to secure an elite role in investment banking or private equity. Let’s begin the build.
Key Takeaways
- Master the “Clean Input” rule to architect robust, desk-ready financial structures that standardize complex acquirer and target data for institutional-grade analysis.
- Execute high-stakes m&a modeling to determine deal accretion or dilution, ensuring every transaction is engineered to enhance shareholder value.
- Evaluate the strategic trade-offs between cash, debt, and equity to optimize the financing mix within the 2026 interest rate landscape.
- Deconstruct Purchase Price Allocation (PPA) to accurately value intangible assets and quantify the financial impact of projected synergies.
- Implement advanced sensitivity analysis to stress-test your assumptions against interest rate volatility and ensure the resilience of your strategic conclusions.
What is M&A Modeling and Why Does it Drive Global Finance?
M&A modeling is a dynamic financial simulation designed to quantify the pro-forma outcome of two companies merging. It isn’t merely a calculation of combined assets; it’s a rigorous stress test of a buyer’s balance sheet and income statement under a new capital structure. In the 2026 regulatory environment, where the FTC and DOJ have intensified scrutiny on deals exceeding the $161.5 million Hart-Scott-Rodino threshold, precision in m&a modeling is the difference between a successful closing and a costly termination fee. For a CEO, the model serves as the definitive roadmap for capital allocation. It translates strategic intent into hard, quantifiable data that Boards use to greenlight multi-billion dollar bets.
The Role of the Merger Model in the Deal Lifecycle
The model functions as the heartbeat of the transaction from initial screening through the definitive agreement. During pre-deal phases, analysts use it to filter targets that meet specific ROIC (Return on Invested Capital) thresholds, often targeting a minimum 10% spread over the WACC. While a DCF valuation determines what a company is worth in a vacuum, the merger model determines what it’s worth to the specific acquirer. In final negotiations, the model dictates the exchange ratio. If the buyer’s stock trades at 22x P/E and the target is at 14x, the model proves how much equity can be issued before the deal becomes financially unviable.
Accretion vs. Dilution: The Ultimate Litmus Test
The primary objective of m&a modeling is determining if a deal is accretive or dilutive. An accretive deal occurs when the combined entity’s earnings per share (EPS) exceed the acquirer’s standalone EPS. This hinges on the trade-off between the target’s earnings contribution and the cost of debt or equity used to fund the purchase. The central mechanic of this simulation is the accretion/dilution analysis, which measures the immediate impact on the bottom line. Public markets often punish dilutive deals. Even if the strategic logic is sound, a 3% to 5% dilution in year one can trigger an immediate sell-off. Investors prioritize immediate earnings stability, meaning analysts must model these sensitivities with extreme accuracy to justify the premium paid to target shareholders.
- Strategic Alignment: Models verify if the $50 million in projected cost synergies are mathematically possible within the first 24 months.
- Financing Mix: It tests the impact of using 60% debt versus 100% equity on the company’s credit rating.
- Risk Mitigation: Sensitivity tables reveal how a 1% increase in interest rates affects the deal’s internal rate of return.
The Architecture of an Institutional-Grade M&A Model
Institutional-grade m&a modeling demands a transition from static templates to fluid, desk-ready architectures. You aren’t just filling cells; you’re building a decision-engine that must withstand the scrutiny of a Managing Director or a Private Equity Investment Committee. The “Clean Input” rule is your primary gatekeeper. You’ll spend 60% of your time standardizing the acquirer and target financials into a unified format. This isn’t just data entry. It’s a rigorous alignment of fiscal year ends, accounting treatments, and non-recurring items. A professional model lives through its core tabs: Assumptions, Sources & Uses, Pro-forma Balance Sheet, and Accretion/Dilution. Every link must be dynamic. A shift in the offer price must instantly recalibrate the interest expense, goodwill, and pro-forma EPS. This level of precision is explored in Contemporary Empirical Merger Analysis, which highlights how data integrity drives deal outcomes.
Step 1: Establishing the Transaction Assumptions
The assumptions tab is the model’s brain. You’ll start by calculating the Offer Price, typically applying a 20% to 40% premium over the target’s current market price. This determines the Equity Value, but the Enterprise Value (EV) includes the target’s net debt and any pension liabilities. Your financing mix is the next critical lever. Whether you use 60% new debt or 100% stock, the impact on the weighted average cost of capital (WACC) is profound. Elite practitioners always build a “Capital Structure” switch. This allows you to toggle between different debt-to-equity scenarios instantly to find the optimal financing floor. You aren’t just guessing; you’re stress-testing the deal’s viability under various market conditions expected in 2026.
Step 2: The Sources and Uses Table
The Sources and Uses table is where the deal’s mechanics are formalized. It’s the check-and-balance system of the entire model. Sources represent the capital inflow: new term loans, senior notes, excess cash from the acquirer’s balance sheet, and equity issued. Uses account for the outflow: the purchase of target equity, the mandatory refinancing of target debt (often 100% of existing facilities), and transaction fees which can range from 1% to 3% of the total deal value. The “Golden Rule” is absolute: Sources must always equal Uses. If they don’t, your pro-forma balance sheet won’t balance. Achieving this balance is the first step toward mastering these technical workflows and securing your place in the top tier of finance professionals.
Analyzing the Financing Mix: Cash, Debt, and Stock
In the 2026 market environment, where the Federal Reserve has stabilized the terminal rate at approximately 4.25%, the cost of capital is no longer a negligible assumption in any deal. Precision in m&a modeling requires a granular breakdown of the three primary funding sources, as each carries distinct implications for the pro-forma balance sheet and accretion/dilution results. Elite analysts don’t just plug numbers; they weigh the strategic trade-offs of each dollar utilized.
- Cost of Cash: This represents the foregone interest income on the acquirer’s balance sheet. With institutional money market funds yielding 4.5% as of early 2026, using cash has a tangible opportunity cost. The after-tax cost is calculated as: Interest Rate * (1 – Marginal Tax Rate).
- Cost of Debt: This is the interest expense on new debt tranches. While debt is often more expensive than cash, it remains cheaper than equity. In the current credit cycle, BB-rated corporate debt averages a 6.8% coupon.
- Cost of Stock: This is the most expensive source, calculated as the reciprocal of the P/E ratio (E/P), or the earnings yield. If an acquirer trades at a 12x multiple, their cost of equity is 8.33%.
When to Use Cash vs. Debt
Cash is almost always the cheapest source of financing, yet it’s a finite resource. Depleting cash can leave a firm without the necessary liquidity for operational emergencies or future R&D. Debt provides a structured advantage by allowing a firm to maintain its cash position while leveraging its balance sheet. The tax shield in M&A modeling refers to the reduction in taxable income resulting from the deductibility of interest payments on acquisition debt. However, analysts must monitor leverage ratios; exceeding a 4.0x Net Debt/EBITDA ratio often triggers credit rating downgrades in the 2026 industrial sector.
The Dilutive Nature of Stock Issuance
Issuing stock is a double-edged sword. While it preserves cash and avoids interest payments, it increases the total share count, which can lead to EPS dilution. Sophisticated practitioners now integrate predictive M&A modeling to simulate how different equity-heavy structures will perform under volatile market conditions. The “P/E Rule of Thumb” is a vital shortcut: if the acquirer’s P/E is higher than the target’s P/E, a 100% stock deal will be accretive. If the reverse is true, the deal is dilutive before synergies are considered.
- 100% Cash: Highest accretion because the foregone interest is usually lower than the target’s earnings contribution.
- 100% Debt: Moderate accretion; the interest expense is higher than the cost of cash but usually lower than the cost of equity.
- 100% Stock: Lowest accretion or most dilutive, as the new shares significantly increase the denominator in the EPS formula.
Mastering this mix is what separates institutional-grade analysis from amateur projections. It’s about finding the “optimal” capital structure that maximizes accretion without compromising the firm’s long-term financial health.
Purchase Price Accounting (PPA) and Synergies
The gap between a target’s book value and the final offer price often represents a “Black Box” for unseasoned analysts. In professional m&a modeling, you must bridge this gap through rigorous Purchase Price Allocation (PPA). This process involves identifying the fair market value of tangible assets and specific intangibles like brand equity, proprietary IP, and existing customer lists. Any remaining value paid above these identified assets is recorded as goodwill. It’s the “plug” figure that represents the premium for future growth and strategic positioning. If you’re calculating a $500 million acquisition of a firm with $100 million in book equity, your PPA must account for every dollar of that $400 million premium to ensure the balance sheet remains in equilibrium.
Asset Write-ups and Deferred Tax Liabilities (DTLs)
Writing up assets to their fair market value creates a direct impact on the pro-forma income statement. Incremental depreciation and amortization (D&A) from these write-ups will decrease your projected net income. You can’t ignore the tax implications here. Because these write-ups are typically not tax-deductible, you must model a Deferred Tax Liability (DTL). This DTL accounts for the 21% or 25% tax difference between book accounting and tax filings. Failing to include this in your accretion analysis leads to an overstatement of the deal’s value. Precision in these calculations separates elite finance professionals from those stuck in middle-management roles.
Modeling Synergy Realization
Synergies are the lifeblood of the deal thesis, yet they’re the most scrutinized part of any model. You need to categorize them with clinical accuracy:
- Cost Synergies: These represent “Hard” synergies. You’ll focus on eliminating redundant headquarters, consolidating IT systems, and reducing overlapping staff. These are easier to predict and typically realize 85% to 95% of their projected value in mature industries. For the logistical execution of headquarters consolidation, you can discover Konkurent VS for professional relocation support.
- Revenue Synergies: Often called “Soft” synergies, these involve cross-selling products or expanding into new territories. Investors view these with skepticism. If you model 100% realization of revenue synergies in year 1, your credibility disappears.
For example, a large medical publisher might acquire a niche pharmacology review platform like pharmedu.com to realize revenue synergies by cross-selling advanced training to its existing network of healthcare professionals, illustrating a common strategic rationale in the education tech space.
Phasing is critical. Institutional-grade models never assume instant realization. You should model a 36-month timeline, often using a 20/60/100 realization schedule. This reflects the 12 to 36 months required to integrate corporate cultures and systems without disrupting operations. Mastering these nuances is how you build a foundation for long-term financial leadership in private equity or investment banking.
Advancing to Mastery: Beyond the Basic Merger Model
A static merger model is a liability. In the high-stakes environment of 2026, presenting a single-point estimate for EPS accretion is a professional risk that elite practitioners don’t take. Institutional-grade m&a modeling demands that you account for volatility and execution risk. If your model doesn’t tell the Board exactly what happens if the Fed hikes rates by 100 bps or if the target’s churn rate spikes by 5%, it isn’t ready for the desk. You aren’t just calculating a deal; you’re stress-testing a corporate strategy. Understanding what is financial modelling at this institutional level is crucial for building models that survive executive scrutiny.
Sensitivity Analysis and Football Fields
Precision requires 2D data tables. You must build dynamic matrices that cross-reference the Offer Price against Synergy Realization. This allows you to identify the “Breakeven” synergy level. Data from 2024 indicates that 38% of cross-border acquisitions failed to meet synergy targets within the first 24 months. Your job is to show the Board exactly how much room for error exists before the deal becomes dilutive. These outputs are essential for any high-caliber Investment Banking Pitchbook. To reach the institutional standard, your model must include:
- Automated Error Checks: Hard-coded flags on a dedicated “Checks” tab that trigger if the Balance Sheet is off by even $0.01.
- Formatting Rigor: Strict adherence to the industry-standard blue-input, black-formula convention to ensure immediate legibility for senior reviewers.
- Audit Trails: Clear labels and comment boxes for every assumption, linking back to 10-K filings, Bloomberg terminals, or management guidance.
Securing the Career Edge with FMU
The gap between a student and a professional is the ability to build a robust model from a blank sheet under intense time pressure. Watching a video won’t prepare you for a three-hour modeling test at a bulge-bracket firm. You need the muscle memory that comes from rigorous, repetitive practice on complex m&a modeling scenarios. Our Investment Banking Certification validates that you’re desk-ready on day one. It’s the definitive signal to recruiters that you possess the technical precision required for elite finance roles. Don’t settle for average skills in a hyper-competitive market. Master the art of M&A modeling with Financial Modelling University today.
Command the High-Stakes World of Global M&A
Mastering m&a modeling isn’t just about technical proficiency; it’s about the ability to navigate $500 million plus cross-border transactions with absolute precision. You’ve now seen how institutional-grade architecture handles complex Purchase Price Accounting and dynamic financing mixes. These 2026 standards require models that withstand the scrutiny of elite investment committees. Relying on basic templates is a risk that high-performance professionals can’t afford. You need the technical rigor of a seasoned practitioner to ensure 100% accuracy in your accretion and dilution analysis. The gap between a junior analyst and a senior dealmaker is defined by the depth of their technical foundation.
You can bridge that gap today. Enroll in the M&A Modeling Masterclass at Financial Modelling University to secure your professional edge. You’ll gain immediate access to downloadable institutional-grade Excel templates and receive 1-on-1 mentoring from former IB Vice Presidents who’ve closed billions in deal volume. Upon completion, you’ll earn a globally recognized certification that signals your elite status to top-tier firms. Your path to financial leadership is ready for execution.
Frequently Asked Questions
What is the difference between a Merger Model and an LBO Model?
A Merger Model evaluates the impact of an acquisition on the acquirer’s Earnings Per Share (EPS), while an LBO Model determines the Internal Rate of Return (IRR) for a financial sponsor. In m&a modeling, you focus on the combined entity’s pro-forma performance and accretion/dilution. In an LBO, you’re solving for the floor valuation that yields a 20% to 25% IRR over a five-year hold period.
How do synergies impact the accretion/dilution analysis?
Synergies act as the primary driver for deal justification by increasing pro-forma net income through cost savings or revenue uplifts. If a firm identifies $50 million in pre-tax cost synergies, it directly offsets the interest expense of new debt. Modeling 100% synergy realization in Year 1 is a common amateur error; institutional-grade models phase these over 24 to 36 months to reflect reality.
Why is Goodwill created in an M&A transaction?
Goodwill is an intangible asset created when the purchase price exceeds the fair market value of the target’s identifiable net assets. It represents the premium paid for brand equity, human capital, or proprietary technology. In industrial deals, goodwill often accounts for 40% of the total transaction value. It remains on the balance sheet unless an annual impairment test proves the asset’s value has dropped.
Is a dilutive merger always a bad deal for the acquirer?
A dilutive merger isn’t a definitive failure if the strategic rationale supports long-term value creation. Many high-growth tech acquisitions show 3% to 7% dilution in the first 12 months. If the target’s growth rate is 20% higher than the acquirer’s, the deal usually becomes accretive by Year 2 or Year 3. This transition rewards patient shareholders with superior terminal value despite the initial EPS hit.
What are the most common mistakes in M&A modeling?
The most frequent errors involve incorrect treatment of deferred tax liabilities or failing to account for the foregone interest on cash when using internal reserves. Professional m&a modeling requires precision in the sources and uses table. Overlooking the $5 million to $10 million in one-time integration costs often leads to inflated accretion projections that don’t survive post-close scrutiny by the board.
How do higher interest rates affect M&A modeling in 2026?
Higher interest rates in 2026 increase the cost of debt, which directly reduces the spread between the target’s yield and the cost of capital. With base rates near 4.5%, the cost of new Term Loan B debt might hit 8% or 9%. This makes all-cash deals more expensive and pushes many acquirers toward stock-heavy structures to preserve their credit ratings and maintain a viable interest coverage ratio.
What is the ‘Rule of Thumb’ for determining accretion in an all-stock deal?
In an all-stock transaction, the deal is accretive if the acquirer’s P/E ratio is higher than the target’s P/E ratio. This mathematical shortcut ignores synergies but provides an immediate snapshot of the deal’s mechanics. If you’re trading at 20x earnings and buy a competitor at 12x earnings, you’re effectively buying earnings at a discount. This creates immediate math-based accretion for your shareholders.
How do transaction fees impact the pro-forma balance sheet?
Advisory and legal fees reduce the pro-forma cash balance and are deducted from retained earnings because they’re expensed immediately. Financing fees are treated differently; they’re capitalized as a contra-liability and amortized over the life of the debt. On a $1 billion deal, the $15 million in advisory fees will create an immediate hit to equity that you must model to ensure the balance sheet squares.


4 Responses