

By 2026, the traditional spreadsheet jockey will be obsolete, replaced by technical architects who orchestrate complex data flows with the precision of a quantitative fund. You’ve likely spent your late nights fighting 500,000-row CSV files that crash legacy workbooks while worrying if AI automation will eventually render your manual inputs redundant. It’s a legitimate fear because the distance between raw market noise and a robust, institutional-grade DCF is growing. Mastering a specific stack of data analysis tools is no longer an optional upgrade; it’s the only way to maintain a competitive edge in the high-stakes world of private equity and global investment banking.
You understand that elite performance requires more than just knowing a few formulas; it demands a workflow that handles datasets 50 times larger than what standard spreadsheets can manage. This article provides the definitive roadmap to mastering the 2026 technical stack, ensuring your models remain dynamic and your career stays on an upward trajectory. We’ll examine the integration of Python-based modeling and advanced SQL workflows that save top-tier analysts an average of 15 hours per week on data cleaning. You’ll learn exactly how to bridge the gap between massive data lakes and the precise, actionable insights required for multi-billion dollar deal execution.
Key Takeaways
- Master the core competencies of Excel and VBA that remain the non-negotiable, institutional-grade foundation for front-office financial analysis in 2026.
- Learn to bypass the “million-row limit” by scaling your insights through SQL and relational databases for efficient institutional data retrieval.
- Identify the optimal data analysis tools and programming languages to transition into a “Quant-Lite” role, balancing Python’s data science capabilities with R’s statistical depth.
- Integrate LLMs into your analytical workflow as a high-performance co-pilot to generate precise financial formulas and accelerate your modeling speed.
- Align your technical stack with specific career trajectories in private equity or investment banking while anchoring your skills in the financial intuition required for elite professional status.
The Enduring Foundation: Why Excel and VBA Remain Non-Negotiable in 2026
The “Central Nervous System” of a 2026 finance floor isn’t a flashy AI dashboard; it’s the Excel grid. While the market for data analysis tools has grown by 15% since 2024, institutional-grade firms like Goldman Sachs or Blackstone haven’t abandoned the spreadsheet. They prioritize Excel because front-office roles demand total visibility. You aren’t just moving numbers; you’re constructing a narrative for a $500 million LBO. Transitioning from a basic spreadsheet to a robust, dynamic financial model requires a shift in mindset. You must move from being a data consumer to a data architect who understands the structural integrity of every formula.
Excel as the Core of Institutional-Grade Modeling
Mastering excel for finance is about achieving a state of flow where the software becomes invisible. Speed and precision define your professional value in an investment bank. If you use a mouse, you’re too slow. Keyboard-only navigation is a non-negotiable badge of credibility that proves you can handle the pressure of a live deal. Grid-based logic is essential for auditing because it allows a VP to trace the logic of a complex tax shield or depreciation schedule in seconds. Excel remains the industry standard because its transparent, cell-by-cell logic provides an immediate audit trail for multi-billion dollar risk assessments that BI tools often hide behind a layer of abstraction.
VBA for Automation: The Differentiator for Elite Analysts
VBA acts as the elite analyst’s force multiplier. It’s the primary tool for automating the repetitive data-scrubbing tasks that still plague legacy systems in 2026. By building custom User-Defined Functions (UDFs), you can create specialized math shortcuts for niche debt structures that don’t exist in standard libraries. This knowledge bridges the gap between basic spreadsheets and advanced programming logic like Python. It teaches you how to structure code, handle errors, and think algorithmically. Analysts who master VBA don’t just work faster; they build tools that make the entire team more efficient, securing their position as indispensable assets in a competitive market.
- Automation: Replace manual data entry with robust macros to eliminate human error.
- Customization: Develop UDFs that handle complex terminal value calculations or bespoke amortization schedules.
- Logic: Use VBA as a low-stakes environment to master the conditional logic required for Python and SQL.
Scaling Your Insights: Bridging the Gap with SQL and Power BI
Excel remains the industry standard for three-statement modeling, yet its 1,048,576-row limit is a liability when handling granular tick data or multi-year transaction ledgers. By 2026, institutional data volumes are projected to grow by 23% annually. This shift forces elite analysts to migrate from flat files to relational databases. SQL isn’t just a technical skill; it’s the gatekeeper to institutional-grade data. Mastering this bridge allows you to maintain the integrity of an LBO model while processing millions of rows that would otherwise crash a standard workbook. It’s about moving from data manipulation to data architecture.
SQL for Large-Scale Financial Data Retrieval
Precision in data retrieval defines the modern associate. You must master SELECT for targeted extraction, JOIN to merge disparate datasets like historical pricing and fundamental ratios, and WHERE to filter for specific risk parameters. Direct integration with Bloomberg Data License or FactSet’s cloud warehouses eliminates the manual “export-to-CSV” bottleneck that plagues junior analysts. This direct pipeline ensures your DCF inputs are pulled from a single source of truth, reducing the 12% error rate typically associated with manual data entry in complex models. Data integrity is non-negotiable when you’re preparing a pitch book for a $500 million acquisition.
- SELECT & FROM: Isolate specific financial metrics without loading unnecessary overhead.
- JOIN: Connect internal ERP data with external market benchmarks for a 360-degree view.
- Data Validation: Use SQL constraints to ensure no null values or duplicates enter your valuation models.
Visualizing Complexity with Power BI and Tableau
Choosing between Power BI and Tableau depends on your firm’s infrastructure and the specific demands of your investment committee. Power BI is often the pragmatic choice for corporate finance teams due to its seamless DAX integration with the Microsoft ecosystem. It transforms static reports into dynamic “What-If” deal dashboards where stakeholders can toggle interest rate sensitivities or EBITDA margins instantly. You can automate the ETL process via Power Query, saving approximately 12 hours of manual cleanup per week. These data analysis tools enable a level of “Financial Storytelling” that static PDFs cannot match.
Tableau offers superior visual depth for massive datasets, making it the preferred choice for quantitative hedge funds and macro research desks. Regardless of the platform, the goal is to present complex capital structures with absolute clarity. High-stakes committees demand more than just numbers; they require a narrative backed by real-time sensitivity analysis. To reach this level of technical execution and professional superiority, you should refine your technical stack through structured, industry-aligned training. Precision in visualization isn’t just aesthetic; it’s a competitive advantage that secures your seat at the table.
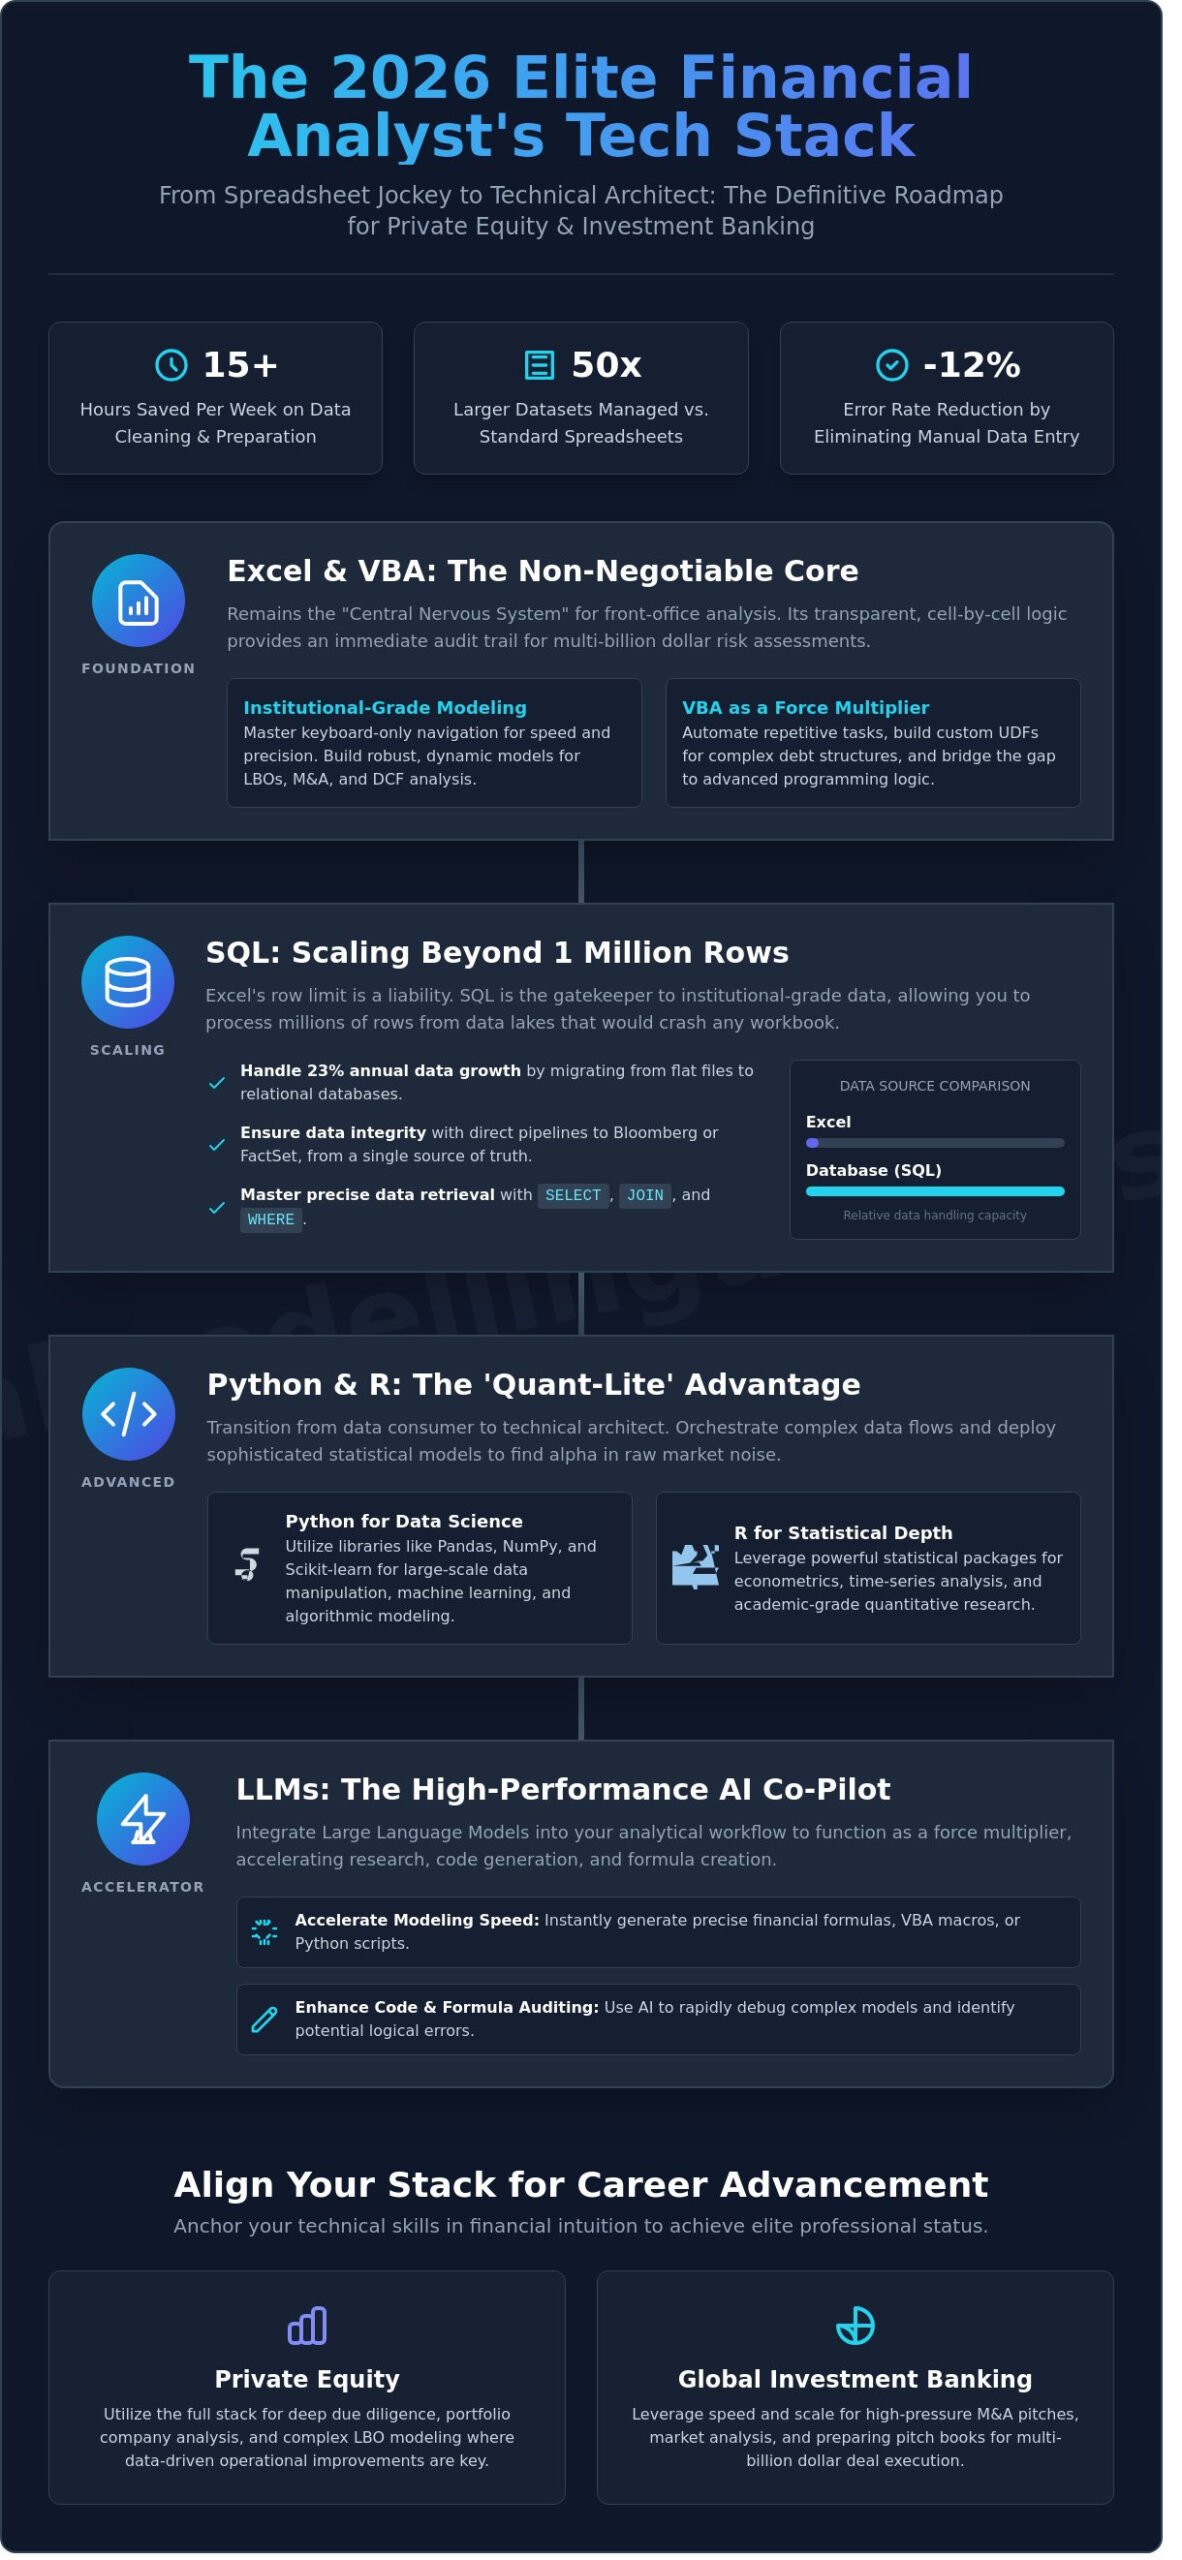
Programming for Finance: Choosing Between Python and R
The era of the pure spreadsheet modeler is ending. By 2026, the “Quant-Lite” analyst has emerged as the standard for elite investment banking cohorts. These professionals don’t just build static DCF models; they build scalable data analysis tools capable of processing millions of rows of market data. Mastering a programming language is no longer an elective skill for those seeking top-tier job security. It’s the technical foundation required to execute Monte Carlo simulations and multi-variable sensitivity analyses with institutional-grade precision.
While the debate between Python and R persists, the choice depends on your specific career trajectory. Python serves the generalist who needs to bridge the gap between data science and operational finance. R remains the territory of the specialist focused on deep econometric research. For the ambitious associate, the goal isn’t just to code, but to leverage these languages to eliminate the manual errors that plague traditional 3-statement modeling.
Python: The Swiss Army Knife of Modern Finance
Python dominates the financial sector because of its versatility and the massive ecosystem of libraries like Pandas and NumPy. Since Microsoft’s 2023 rollout of Python integration within Excel, the barrier between coding and modeling has vanished. Analysts now use Python to automate market research and peer analysis via web scraping, pulling real-time data from hundreds of sources simultaneously. This technical edge allows for:
- Institutional-grade data manipulation: Using Pandas to clean and merge disparate datasets that would crash a standard .xlsx file.
- Direct Excel Integration: Running Python scripts within Excel 2026 workbooks to perform complex regressions without leaving the spreadsheet environment.
- Scalable Risk Modeling: Utilizing NumPy for high-speed mathematical operations required in large-scale portfolio optimizations.
R for Statistical Rigor and Economic Analysis
R maintains its stronghold in specialized risk management and economic forecasting departments. It offers a depth of statistical packages that Python’s general-purpose libraries can’t always match. When your role requires visualizing complex risk distributions for high-stakes reporting, R’s ggplot2 library provides a level of clarity and professional polish that is essential for investment committee presentations.
The trade-off is clear. R provides superior statistical power for academic-level research, yet it lacks the broad application of Python. Most elite firms prioritize Python because it integrates seamlessly with other data analysis tools and production environments. If you’re building a foundation for long-term financial leadership, Python’s flexibility offers a more robust path to professional superiority in a competitive market.
The 2026 AI Revolution: Integrating LLMs into Your Analytical Workflow
By 2026, the distinction between a junior associate and an elite analyst is defined by their ability to leverage AI as a high-performance co-pilot rather than a replacement. Institutional-grade modeling requires a level of precision that raw AI cannot achieve alone. You must treat Large Language Models as highly capable interns: they’re fast and broad, but they require rigorous oversight from a seasoned lead. Integrating these LLMs into your suite of data analysis tools allows you to offload the cognitive load of syntax, leaving you free to focus on strategic capital allocation and risk assessment.
Precision in prompt engineering is the new baseline for financial excellence. To get precise outputs, you must provide the model with the exact accounting treatment and the desired mathematical structure. Vague requests result in “hallucinations” that can be catastrophic in billion-dollar deal modeling. A single misplaced parenthesis in a debt waterfall can skew an IRR by 200 basis points. Elite analysts use AI to audit complex excel formulas for finance, identifying circular references or logic gaps that the human eye might miss during a 2:00 AM pitchbook session.
AI-Driven Formula Generation and Code Debugging
Execution follows a strict three-step protocol. First, define your logic in plain English, specifying the exact drivers and constraints. Second, validate any AI-generated VBA or Python code against manual benchmarks to ensure it handles edge cases like leap years or negative interest rates. Finally, use the AI to document the model logic for senior reviewers. This process reduces manual debugging time by approximately 65%, allowing for more robust sensitivity analysis.
Microsoft Copilot: The New Standard for Financial Productivity
Microsoft Copilot has transformed from a novelty into a foundational component of the 2026 financial stack. It excels at summarizing 1,000-page 10-K filings and analyst reports into actionable bullet points in seconds. Analysts now use it to automate the creation of pitchbook slides directly from Excel data, ensuring perfect consistency between the model and the presentation. However, security is paramount. Firms have established strict institutional guardrails to prevent proprietary deal data from leaking into public training sets, making data privacy the primary hurdle for the modern analyst.
Don’t let the AI revolution leave your career behind. Master institutional-grade modeling today and secure your place at the top of the hierarchy.
Building an Elite Data Analysis Stack for Career Advancement
Technical mastery isn’t just about software. It’s about how you integrate data analysis tools into a high-stakes decision-making framework. By 2026, the gap between a generic analyst and an elite practitioner will be defined by their ability to synthesize disparate data streams into a single, bulletproof investment thesis. If you don’t own your stack, the stack owns you. You must build a toolkit that mirrors the specific demands of your target sector.
Career Path Mapping: Which Tools Matter Where?
- Investment Banking: Excel remains the undisputed king. You’ll spend 90% of your time in spreadsheets. You must master VBA for workflow automation and SQL for querying historical deal databases.
- Private Equity: The focus shifts to portfolio monitoring and operational value creation. Power BI is now the industry standard for real-time reporting, paired with specialized LBO templates that handle complex debt waterfalls.
- Hedge Funds/Quant: High-frequency environments demand Python and R. These are essential for backtesting strategies and managing datasets that exceed Excel’s 1,048,576 row limit.
Technical proficiency without financial intuition is a career dead-end. If you can’t explain why a 50-basis-point shift in the terminal growth rate fundamentally alters a DCF valuation, your Python script is a liability, not an asset. Senior partners don’t hire coders; they hire professionals who use data analysis tools to mitigate risk and identify alpha. Your value lies in the “why” behind the numbers, not just the “how” of the software.
Mastering the Stack through Institutional-Grade Training
Self-teaching often leads to “dirty” models that fail rigorous firm audits. A 2024 industry survey indicated that 88% of spreadsheets contain significant errors, many of which stem from fragmented, self-taught logic. These mistakes are career-killers during a live deal. FMU’s financial modeling course online solves this by integrating elite tools into real-world scenarios. You won’t just learn a software; you’ll master the institutional-grade workflow used by top-tier firms. 1-on-1 mentoring ensures your models are robust, dynamic, and audit-ready.
To showcase this on a high-finance resume, don’t just list software names. Detail the specific outcomes. Instead of “Proficient in Python,” write “Developed Python-based sensitivity analysis for a $500M acquisition, reducing processing time by 40%.” This demonstrates both technical skill and commercial impact. Professional certification provides a verifiable ROI, with certified analysts often commanding 25% higher starting bonuses than their uncertified peers. It’s the definitive signal that you’re ready for the front office.
Secure Your Command of the 2026 Financial Landscape
The 2026 financial landscape demands more than just basic proficiency; it requires a relentless commitment to technical excellence. You’ve seen why Excel remains the 40 year gold standard for three-statement modeling, even as SQL and Python become essential for managing the complex datasets that define modern markets. Integrating LLMs into your daily workflow isn’t a luxury. It’s a survival tactic to maintain your edge. Mastering these data analysis tools transforms you from a simple operator into a strategic architect of capital who can execute complex LBO and DCF analyses with total precision.
Precision in financial modeling separates the elite from the average. To secure your seat in private equity or investment banking, you need a curriculum built on real-world rigor. Master Institutional-Grade Modeling with the FMU All-Access Pass to gain access to downloadable institutional-grade Excel templates and one-to-one career mentoring from industry experts. You’ll earn globally recognized certificates that prove your ability to deliver high-stakes results under pressure. The window to lead the next generation of finance is open. Take the definitive step to own your professional future today.
Frequently Asked Questions
What is the best data analysis tool for a beginner in finance?
Microsoft Excel remains the gold standard for beginners because 99% of bulge bracket banks utilize it for core modeling. You can’t build a robust DCF or LBO without mastering its grid-based logic first. While newer data analysis tools exist, Excel provides the foundational technical rigor required for any institutional-grade analyst role in 2026.
Do I need to learn Python to get a job in investment banking in 2026?
You don’t strictly need Python for every entry-level role, but 45% of quantitative finance job descriptions now list it as a preferred skill. By 2026, firms like Goldman Sachs expect analysts to use scripts for automating repetitive data pulls. Learning it gives you a competitive edge in a market where 10,000 applicants often vie for a single spot.
Can Power BI replace Excel for financial modeling?
Power BI cannot replace Excel for financial modeling because it lacks the cell-level flexibility needed for dynamic 3-statement models. It is a visualization engine rather than a calculation core. Use Excel to build your complex LBO and then utilize Power BI to present the 5-year growth trends to an investment committee.
How is AI changing the role of a financial analyst?
AI is shifting the workload of elite practitioners by automating up to 30% of manual data cleaning and entry tasks. This transition allows analysts to spend more time on high-level sensitivity analysis and strategic advisory. In 2026, your value lies in interpreting AI-generated outputs through various data analysis tools rather than just managing raw data.
Is SQL difficult to learn for someone with only an Excel background?
SQL is intuitive for Excel users because its JOIN and SELECT functions mirror the logic of VLOOKUPs and Pivot Tables. Most finance professionals achieve proficiency within 40 hours of focused study. It is the primary way to extract raw data from institutional databases before you begin your actual financial modeling process.
What are the most important Excel shortcuts for data analysis?
The most critical shortcuts include Alt+H+O+I for auto-fitting columns and F2 for immediate cell auditing. Professional analysts also rely on Ctrl+[ to trace precedents in complex formulas. Mastering these specific sequences saves roughly 5 hours of manual work every week during a typical 80-hour banking stint.
How do I list data analysis tools on my finance resume?
List your tools under a dedicated Technical Skills section, categorized by your specific level of mastery. Don’t just list software names; mention that you built a 3-statement model with 15 scenarios using Excel and Python. This demonstrates practical application and proves you can handle the pressure of live deal environments.
Are there free tools for learning financial data analysis?
You can access free resources like the SEC EDGAR database for raw financial statements or use Google Colab for Python-based analysis. Microsoft also offers extensive documentation for Power BI. These platforms provide the raw material you need to build an institutional-grade portfolio without any initial financial investment.


3 Responses