


The hold period should be a changeable input, not a fixed limit. A cash flow waterfall model in Excel can use a dynamic hold period of up to 120 months. That lets you see how timing affects CFADS, promote distributions and equity returns.
Changing the hold period only helps if cash flows still follow the deal’s distribution priorities. The model should show how operating cash is allocated, where debt service ranks, and when excess cash reaches investors and the sponsor.
This guide explains how to structure a cash flow waterfall model in Excel around annual or monthly periods, calculate CFADS, and allocate cash through an equity waterfall. It also covers promote tiers and how a different hold period affects the result. The aim is practical: make the distribution logic clear and keep the calculations connected.
Choose annual or monthly periods based on the timing of cash flows and the decisions the model must support. Annual analysis makes long-term returns easier to review, while monthly periods expose timing differences within each operating year. A real estate equity waterfall model can support analysis periods of up to 10 years on annual or monthly timelines. Its dynamic hold period can extend up to 120 months, allowing the exit month to change without rebuilding the schedule.
Keep period dates consistent across operating cash flow, debt service, and distributions. Monthly rows should use matching start and end dates so each cash flow lands in the right period. To summarise monthly results by year, use SUMIF with a year label for each month. Choose calendar, financial, or operating years to match the reporting basis. For a financial year, make sure labels reflect its actual start and end dates, not calendar boundaries.
Annual periods can conceal the sequence of receipts and payments. Monthly periods make it easier to see whether cash arrives before a payment date or whether an exit occurs mid-year. The model added a monthly version in April 2021. Monthly IRR calculations use XIRR, which incorporates the dates of cash flows rather than treating every period as equally spaced. Check that the dates in the return calculation match the dates in the cash flow schedule.
For a revolving funding view, connect the time axis to a project pipeline. A sound SRF cash flow model can include a project pipeline covering funding needs in the next 1-3 years, according to the U.S. Environmental Protection Agency. Use dated inflows and outflows to show when funding is needed, not just the total requirement. In Excel, test the model by changing the hold-period input and confirming that cash flows after the selected exit period no longer affect distributions. Compare the annual summary with the monthly schedule to catch omissions or misaligned dates.
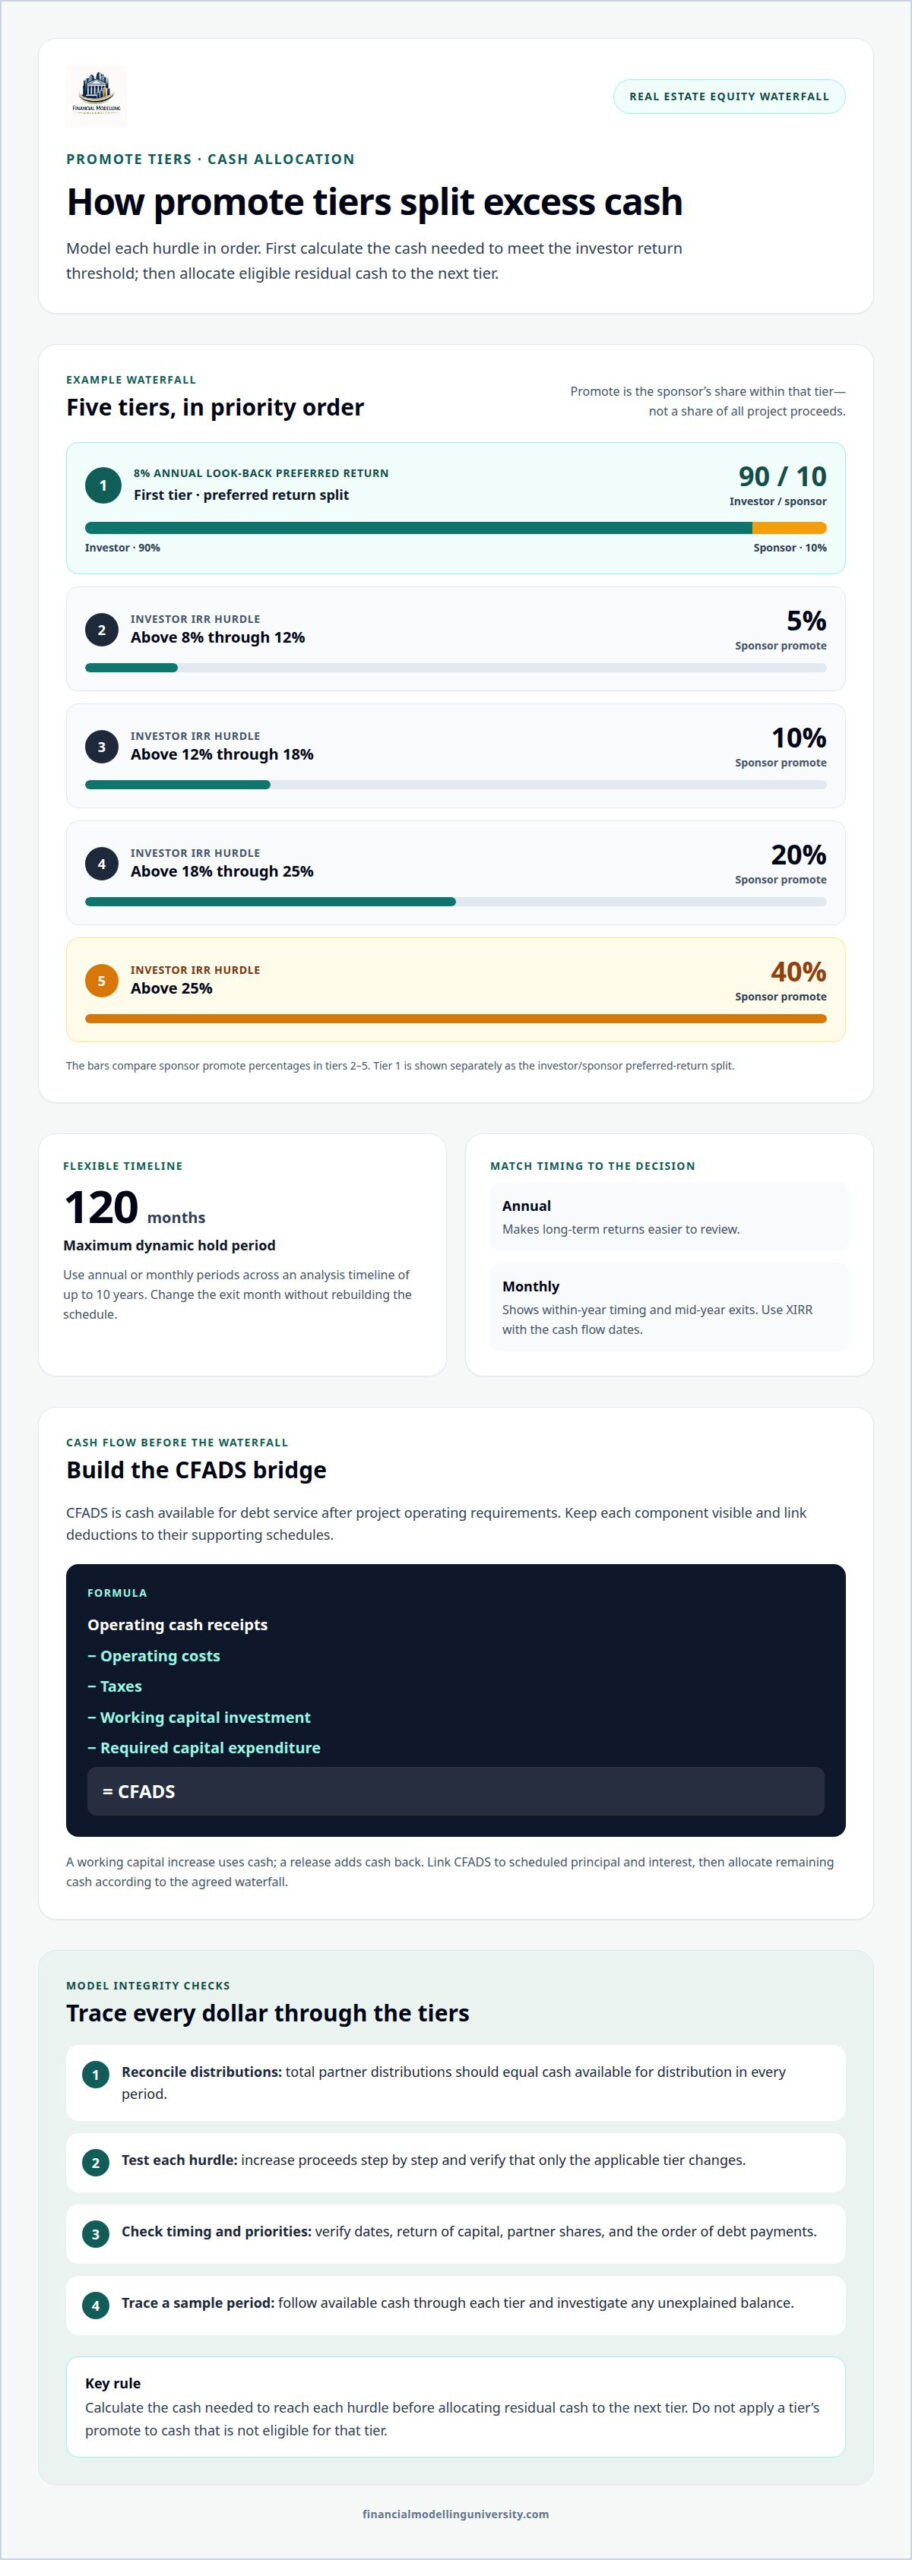
A promote changes how excess cash is split after investors reach agreed return hurdles. Model each tier separately, with its hurdle, sponsor promote and distribution limit clearly labelled. In one example, Tier 1 pays an 8% annual look-back preferred return, split 90% to the investor and 10% to the sponsor. Tier 2 gives the sponsor a 5% promote on cash above an 8% investor IRR through a 12% investor IRR.
The same example applies a 10% promote above a 12% investor IRR through 18%, then 20% above 18% through 25%. Above a 25% investor IRR, Tier 5 assigns the sponsor a 40% promote. These percentages describe the sponsor’s share within each tier, not a share of all project proceeds. Calculate the cash required to meet each hurdle before allocating residual cash to the next tier. Stop at each threshold before moving onward.
Free Excel downloads include the Typical Cash Flow Waterfall Excel Template and PDF manual, plus the IRR Equity Waterfall Template Excel. Compare their tier logic with the partnership terms before relying on the outputs.
Common errors include applying a promote to all cash instead of cash eligible for that tier, reversing partner shares, and mishandling return of capital. Incorrect dates can also distort look-back IRR calculations, triggering a promote too early or too late.
To test and audit the model, confirm that total partner distributions equal cash available for distribution in every period. Run a low-cash case, then increase proceeds until each hurdle is crossed, verifying that only the applicable tier changes. Review formulas for hard-coded inputs, check dates, and reconcile contributions, returned capital, and distributions. Then trace a sample period from available cash through every tier. Investigate any unexplained balance or allocation before relying on the output.
CFADS is the cash available to meet scheduled debt payments after project operating requirements. In a project finance model, it drives debt repayment calculations and ratios. Start with operating receipts, then deduct operating costs, taxes, working capital movements, and required project expenditure. The resulting cash flow feeds the debt schedule. Keep each component visible so reviewers can trace the bridge from revenue to debt capacity.
In a cash flow waterfall model in Excel, calculate CFADS consistently for each analysis period. A basic structure is: CFADS = operating cash receipts − operating costs − taxes − working capital investment − required capital expenditure. The exact items depend on the project’s cash flow definitions and financing terms. Separate assumptions from formulas, and link each deduction to its supporting schedule. For example, an increase in working capital uses cash, while a release adds cash back. Keep sign conventions consistent throughout the model.
Next, link CFADS to debt service. The debt service coverage ratio compares CFADS with scheduled principal and interest to show the cash available to cover those payments. Define which debt payments and cash flow items belong in the numerator and denominator before calculating the ratio. If a project has several debt tranches, apply payments according to seniority and the term sheet. A lower-cash scenario should preserve that priority rather than allocate cash to junior debt first.
A project finance cash flow waterfall orders revenue, expenses, tax, debt service, distributions, and net cash movement. Add an integrity check that flags a negative closing cash balance. Then reduce operating receipts or increase costs and confirm that CFADS falls and debt repayment responds through linked formulas. Reconcile opening cash, period inflows, period outflows, and closing cash. If they do not balance, inspect timing, signs, and duplicated deductions before relying on the debt ratios. This structure distinguishes cash available to lenders from excess cash distributed to equity.
Real estate waterfalls translate partnership terms into a sequence of cash allocations. Their structure should make each partner’s entitlement traceable from property cash flow to final distribution.
Build the schedule around the partnership agreement, keeping property cash flows separate from partner-level distributions. Enter dated contributions and available proceeds, then calculate each allocation in contractual order. Link the resulting partner cash flows to return calculations and check for cash remaining after distributions. This sequence helps identify whether an input, timing assumption, or formula is driving an unexpected result.
Real estate waterfalls usually operate at the individual investment level. Private equity arrangements may allocate proceeds by deal, while fund waterfalls can calculate entitlements across a portfolio. This distinction affects which investments and cash flows enter each hurdle test, so define the calculation scope before modelling partner returns.
A hurdle rate sets the return condition for moving into another allocation tier. Common structures return contributed capital before allocating remaining proceeds; others prioritise an investor return or use a pari-passu split. The partnership terms determine the sequence and hurdle measure. Make each threshold explicit so users can see why cash moves from one tier to another.
For a real estate waterfall, document whether distributions are based on property-level cash, sale proceeds, or both. A look-back calculation evaluates partner returns using cash flows over the investment period; a current-period split allocates available cash for that period. These methods can produce different tier outcomes, even with the same total proceeds.
Capture partner contributions and dates, distributable cash, allocation order, hurdle measures, tier boundaries, and partner splits. Include the selected hold period and any assumptions affecting cash available for distribution. Keep inputs separate from formulas, and label whether returns use dated cash flows or a cumulative measure. Clear inputs make it easier to compare the model logic with the agreement, which is vital when presenting returns to prospective limited partners. For sponsors looking to refine their deal pitch and secure commitments early, real estate syndication capital raising coaching provides guidance on building an active investor pipeline before taking a deal live.
Finally, test boundary cases around each hurdle. Check that a small change in proceeds shifts only the relevant allocation, and confirm that total partner distributions reconcile to available cash. If a tier remains unused, show it clearly rather than leaving ambiguous formulas in the schedule.
Financial Modelling University offers the LBO Financial Models online course for learners developing practical Excel modelling skills. Its step-by-step lessons, downloadable course materials and exercises provide structured practice with linked financial statements, debt schedules and returns analysis. These skills help you build disciplined models and trace how assumptions affect cash flow and investor returns.
Choose the course for guided practice beyond reviewing waterfall concepts. Its focus is LBO modelling, so it does not replace real estate partnership terms or a property-specific distribution model. Use the learning materials to strengthen your Excel foundations, then apply the same discipline when mapping a real estate waterfall’s inputs, formulas, and checks.
Explore the LBO Financial Models online course, or visit financialmodellinguniversity.com to learn more.
A cash flow waterfall model in Excel is most useful when it answers an investment question, not merely produces a distribution schedule. Use it to compare possible outcomes, identify which assumptions drive partner returns, and explain the logic behind each allocation. Keep the model clear enough for another analyst to follow, with traceable inputs and formulas from source to result.
Before relying on an output, change a key assumption and observe how the model responds. Does the result change for the expected reason? Can you explain the effect to an investor or colleague without stepping through opaque calculations? This discipline turns financial modelling into a practical decision tool.
For structured learning in financial modelling, explore the available courses and choose a path that fits your next modelling goal. Keep testing your assumptions, sharpening your Excel methods, and building models you can explain with confidence.
Yes. Set the exit month through the model’s dynamic hold-period input, which can extend up to 120 months. For a shorter investment, use the planned sale month and review whether the final distribution occurs in that period. This helps prevent cash flows after exit from affecting partner returns and keeps the model aligned with the investment timeline.
Yes. Assign each contribution and distribution to its expected date, then distinguish cash types such as return of capital, preferred return, and promote distributions. This lets the schedule reflect when a payment occurs, not just its total amount. For example, a late-period promote payment should affect dated investor returns differently from an earlier payment of the same amount.
It can use IRR hurdles, equity multiple hurdles, or a combined setting in which the LP receives the lesser result of the two hurdle calculations. IRR reflects both cash amounts and timing; an equity multiple compares total distributions with contributed capital. Choose the measure that matches the partnership terms, and ensure the model’s hurdle input uses the same definition.
Promote shares follow the partnership’s agreed allocation for each tier and apply once the relevant investor hurdle is met. In Excel, keep the hurdle test separate from the split calculation: first determine the cash eligible for that tier, then allocate it using the investor and sponsor percentages. This prevents a tier’s promote from being applied to distributions that belong to an earlier priority.
Show GP fees separately from promote distributions, then place them according to the partnership agreement. The agreement determines whether a fee reduces cash available before the waterfall or is paid through another allocation. Use a distinct input and calculation line for each fee so it remains visible in partner cash flows and is not deducted twice or mistaken for carried promote.
The model supports four tiers by default, with an option to add a fifth. Its tier-count input allows a selection from 2 to 5 tiers. Use only the number required by the partnership’s distribution terms, and make each hurdle boundary explicit. If thresholds overlap or leave gaps, cash may be allocated incorrectly or remain undistributed despite available proceeds.