

A clean-looking LBO model can still misstate returns when operating forecasts and the debt schedule do not connect. Common LBO modelling pitfalls include unsupported revenue or margin assumptions, overlooked working capital needs, and mixing operating cash flow with financing flows.
An LBO model projects a business’s performance after an acquisition funded partly with debt. It links operating drivers to cash available for interest and debt repayment, then shows how remaining debt and exit value affect investor returns. The challenge is keeping every link transparent and consistent.
This article explains how to build and test revenue, cost and cash flow drivers, separate operating cash from financing movements, and assess the trade-offs of traditional LBO modelling. It also shows why exit timing and exit multiple can materially change projected returns, and how model checks can expose errors before they distort your conclusion.
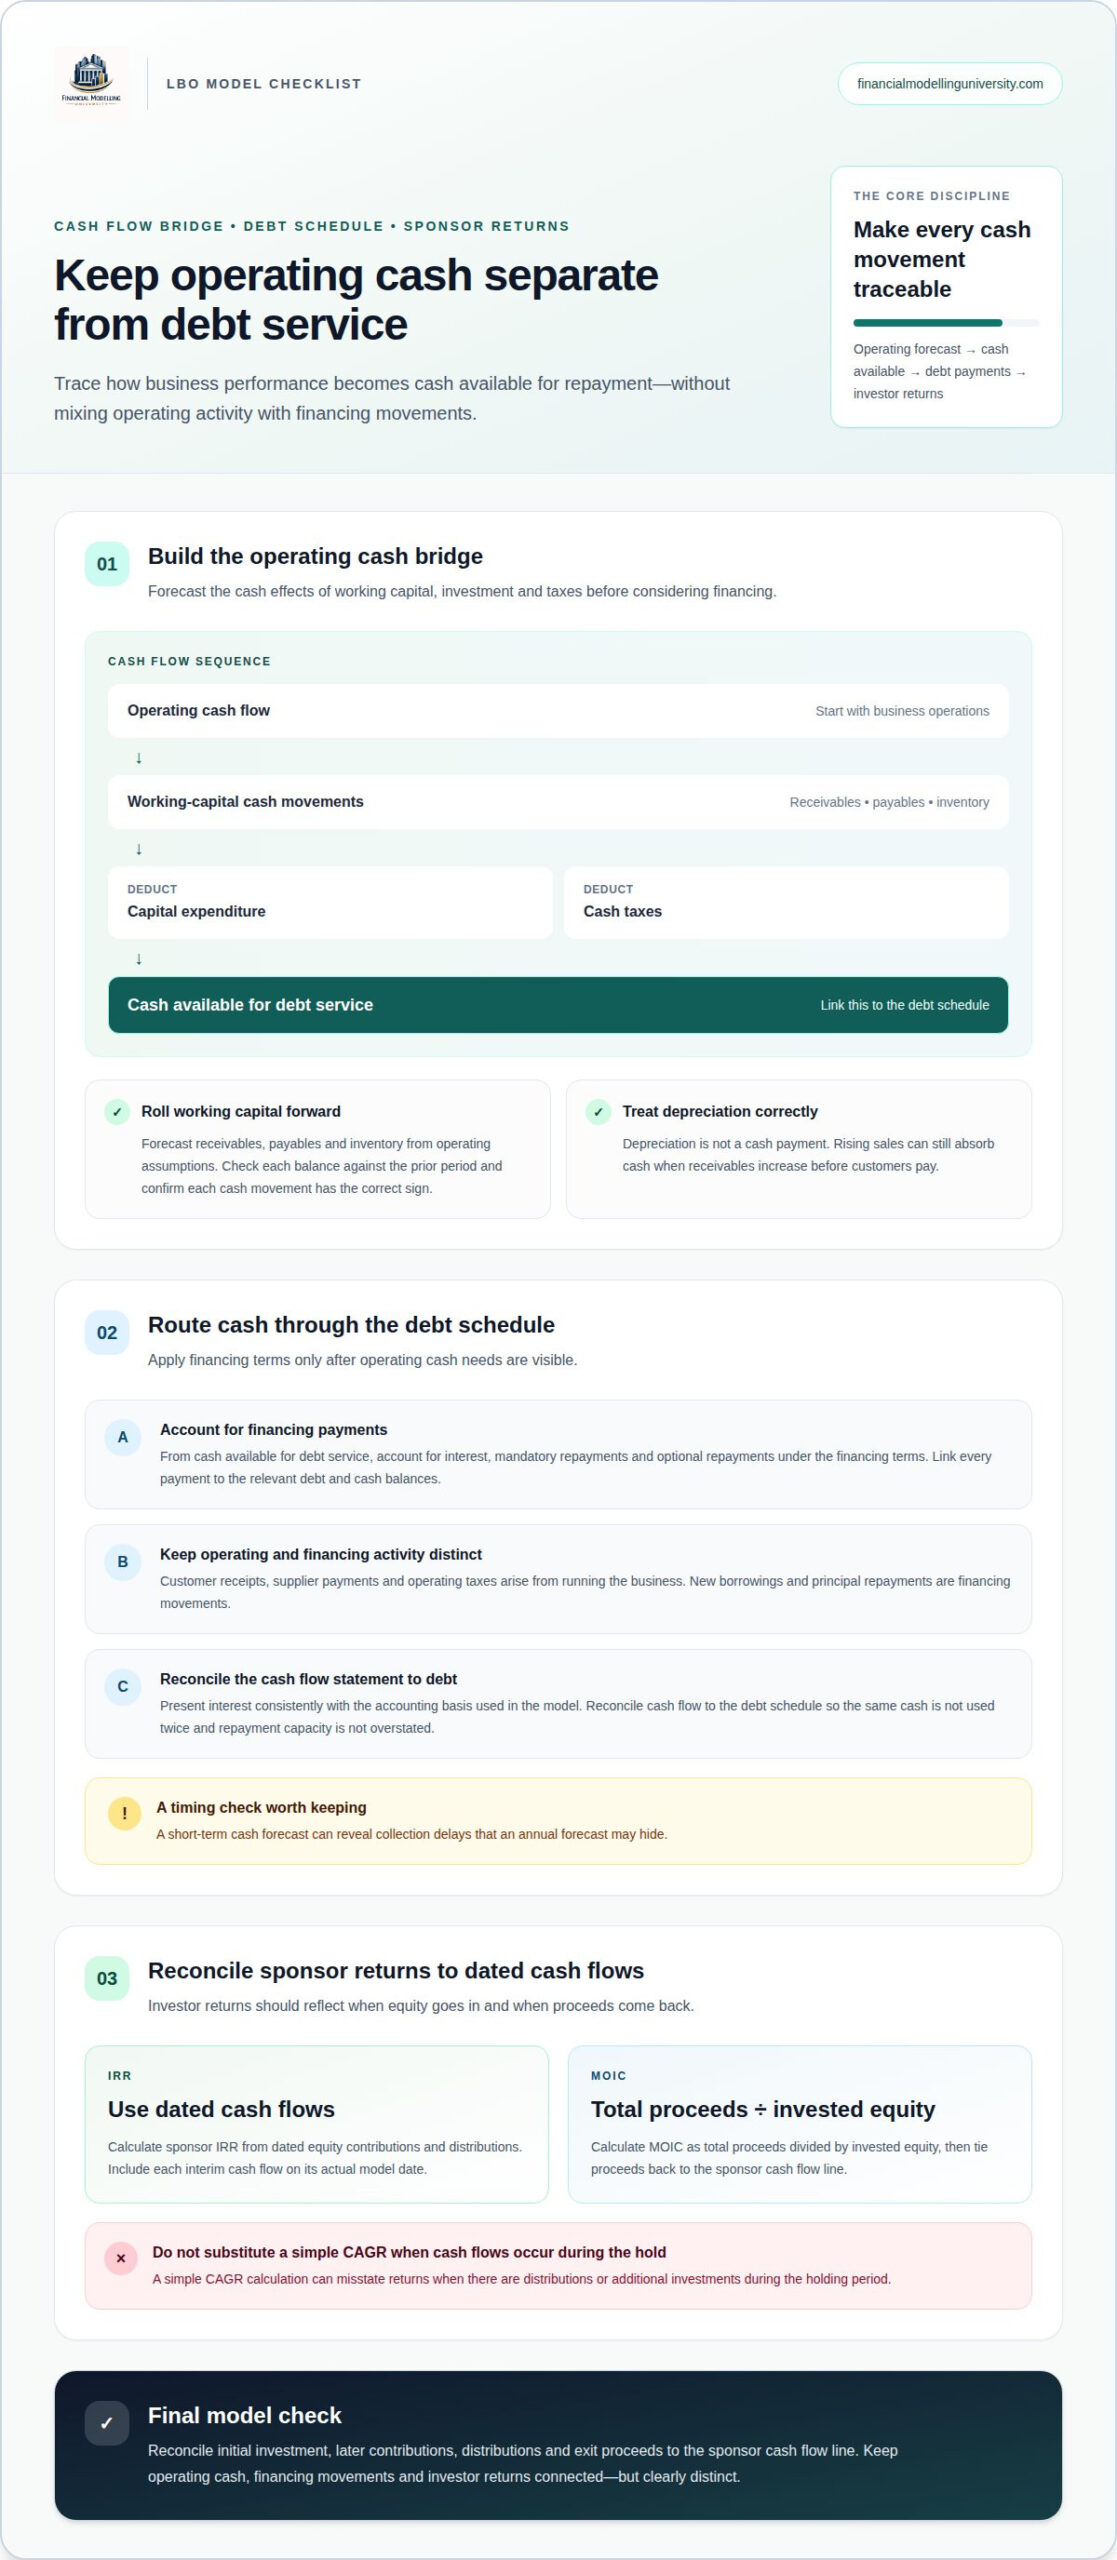
Build the cash flow bridge to keep operating performance, investment needs and financing movements distinct. This makes cash available for debt service traceable to the forecast, rather than an assumption based on EBITDA alone.
Forecast receivables, payables and inventory from operating assumptions, then calculate changes in those balances as cash movements. For example, rising sales may increase receivables when customers pay after revenue is recognised. Subtract capital expenditure and cash taxes in the operating cash flow bridge, but do not treat depreciation as a cash payment. Check that working capital balances roll forward from the prior period and that each cash movement has the correct sign.
Calculate cash available for debt service from operating cash flow after working capital, capital expenditure and cash taxes. Then account for interest, mandatory repayments and optional repayments under the financing terms. Link each payment to the relevant debt and cash balances. This prevents the model from using the same cash twice or showing repayment capacity the operating forecast does not generate.
A traditional LBO model connects acquisition assumptions to projected sponsor returns in a structured framework. Its strength is transparency; its limitation is that outputs can look precise even when key assumptions remain uncertain.
Debt structure affects cash available for repayment and the equity remaining at exit. Model each financing source from its documented terms, not a generic assumption.
Enter each tranche separately, using its contractual principal, interest rate, maturity, fees and repayment priority. Link interest expense to the relevant balance and rate, and reflect rate changes only when the financing terms support them. Reconcile total debt sources to the transaction’s funding requirements alongside sponsor equity. Avoid blending tranches, which can hide differences in cost, maturity and claim priority.
Build mandatory repayment rules from the loan terms, then calculate optional repayments from cash remaining after operating needs and required payments. Roll each tranche forward as opening balance plus borrowing, less principal repayments. Apply optional repayment in the specified order and stop when the relevant balance is repaid. This avoids reducing debt twice or allocating cash the target needs to operate.
Calculate leverage as debt divided by the EBITDA measure used in the financing analysis. Calculate debt service coverage by comparing cash available for debt service with scheduled principal and interest, using consistent periods and definitions. Review both measures under lower-earnings and higher-interest scenarios. A single base case can obscure liquidity pressure, so track cash balances alongside coverage and repayment capacity.
Financial Modelling University’s LBO Financial Models online course is a practical next step for learning to build and check the debt schedule, operating forecast and sponsor returns in an integrated Excel model. Course materials include downloadable Excel models and templates, along with practical financial modelling exercises. Use this structured practice to test how changes in revenue, working capital, interest and repayments flow through to returns, and to strengthen your model review process. For valuation work that complements LBO analysis, the DCF & Valuation online course covers a related modelling area. Contact Financial Modelling University to discuss which course fits your learning goals.
The lbo model pitfalls to avoid are easier to control when every assumption is traceable in the spreadsheet. Carry that discipline into your next model: label inputs, separate calculations from hard-coded values, and connect operating forecasts, financing movements and sponsor returns with clear formulas. Then test whether changes in operating drivers flow through to cash, debt and equity value without breaking the model checks.
Use the finished model as a decision tool, not just a return calculator. A clear structure helps colleagues challenge assumptions, compare scenarios and understand what drives the investment case. If you want to practise building and reviewing financial models, explore Financial Modelling University’s courses and choose a learning path that fits your next modelling goal.
Keep strengthening the links between assumptions and outputs. Consistent checks and a transparent structure can help you approach your next LBO model with greater confidence.
An LBO model is an Excel forecast used to analyse an acquisition financed with debt and investor equity. It connects the target’s operating performance and financing to the sponsor’s potential proceeds at exit. For example, it can show how a change in sales volume affects EBITDA, cash available for debt repayment and the equity value remaining when the business is sold.
The three core drivers are EBITDA growth, debt reduction and the change in the enterprise value multiple between entry and exit. EBITDA growth can increase exit value if the exit multiple holds, while debt repayment can increase the equity share of that value. Multiple expansion can also raise proceeds, but it adds valuation risk rather than improving operations.
No single exit multiple suits every transaction. Set a base case using the target’s expected position at exit, its earnings profile and relevant valuation evidence. Then test a range around that case. If returns depend on an exit multiple higher than the entry multiple, make that reliance clear and examine whether operating progress supports the difference.
Common errors include hard-coded outputs, inconsistent signs, broken links between schedules and formulas that double-count cash flows. For example, a repayment may reduce debt on the balance sheet without reducing cash in the cash flow schedule. Trace key outputs back to their inputs, test formulas across forecast periods and confirm the model balances after changing assumptions.
A frequent forecasting mistake is applying one growth rate to every revenue stream, even when volumes, prices or customer mix change differently. Margin forecasts may also assume scale benefits without linking them to specific costs. For cash flow, align receivables, payables and inventory with the operating forecast; otherwise, projected profit may not convert to cash on schedule.
Model each expense using its agreed basis and timing instead of combining costs in one plug. Calculate a management fee using its stated rate and defined base, and build transaction expenses from relevant deal cost assumptions. Record each item once, in the correct period and schedule. At closing, include applicable transaction expenses in uses so funding sources reconcile to total uses.