

A financial model can be mathematically sound yet hard to trust if its logic is difficult to follow. Knowing how to present a financial model means making the decision, key assumptions and scenario differences clear while keeping the workbook easy to review. For example, a revenue forecast should show whether growth comes from volume, pricing or both, rather than burying the driver in a single output. Clear presentation helps readers trace the path from operating assumptions to cash flow and valuation.
Reviewers need to understand not only what the model concludes, but also which assumptions drive that conclusion and how sensitive it is to change. This guide explains how to present base, upside and downside scenarios, organise worksheets, document sources and assumptions, and simplify formulas without hiding important mechanics. It also covers practical checks that help a three-statement model, DCF or LBO communicate its results clearly. Apply these principles to make your work easier to review, discuss and update.
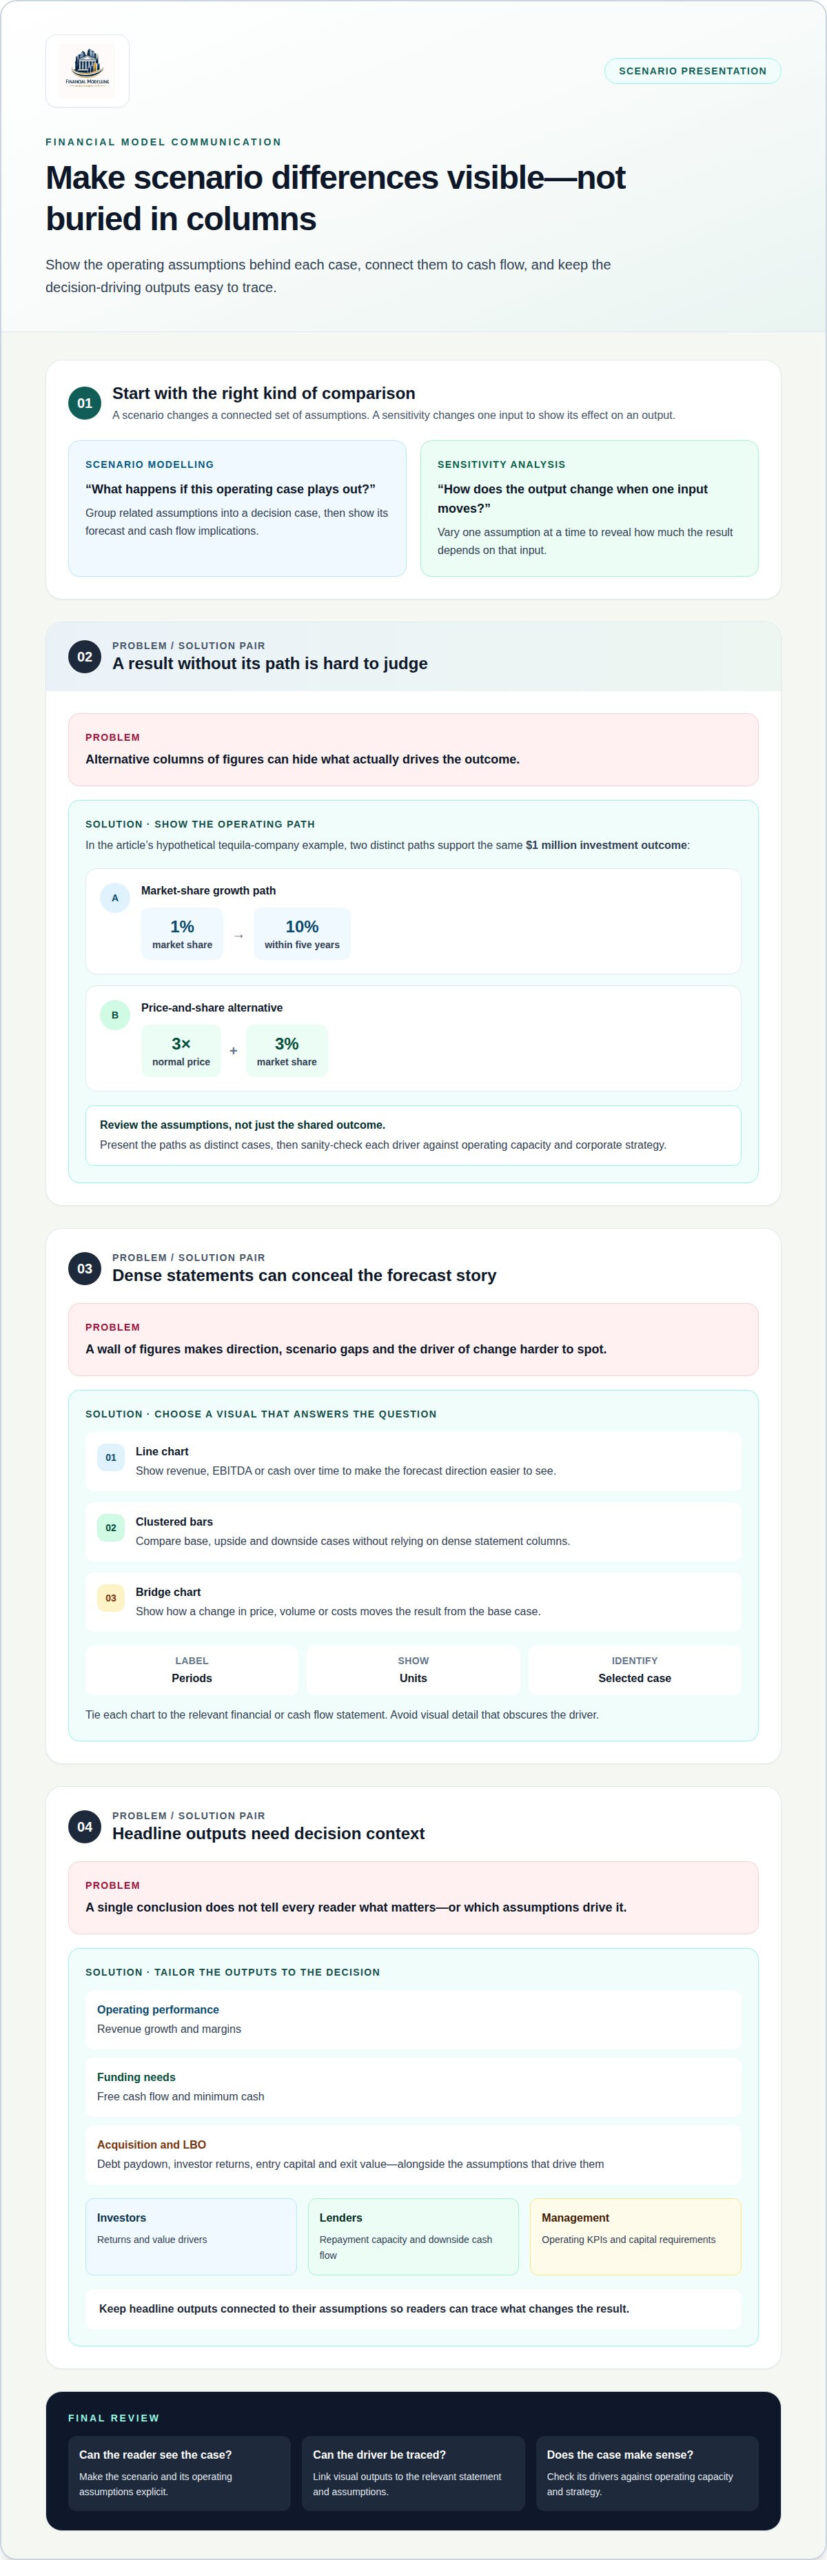
Present scenarios as decision cases, not simply alternative columns of figures. Pair each forecast with its operating assumptions and cash flow implications.
Scenario modelling combines related assumptions, while sensitivity analysis changes one input to show its effect on an output. Both help readers judge whether financial performance depends on a plausible operating case or a fragile assumption. For example, a hypothetical tequila company would need market share to rise from 1% to 10% within five years to support a $1 million investment outcome; an alternative case reaches that outcome by selling at three times the normal price and capturing 3% of the market. Present these as distinct paths, then sanity-check their drivers against operating capacity and the corporate strategy.
Use a line chart to show revenue, EBITDA or cash over time, and clustered bars to compare base, upside and downside cases. These visuals make the forecast direction and scenario gaps easier to see than dense financial statements. Label periods, units and the selected case, and tie the chart to the relevant financial or cash flow statement. A bridge chart can show how a change in price, volume or costs moves the result from the base case. Avoid visual details that obscure the driver.
Highlight outputs relevant to the decision: revenue growth and margins for operating performance, free cash flow and minimum cash for funding needs, or debt paydown and investor returns for an acquisition. In an LBO, show entry capital, exit value and returns alongside the assumptions that drive them. Tailor the emphasis to the audience: investors need returns and value drivers, lenders need repayment capacity and downside cash flow, while management needs operating KPIs and capital requirements. Keep headline outputs connected to their assumptions so readers can trace what changes the result.
A forecast becomes difficult to audit when its inputs have no traceable source or rationale. Record each material assumption beside the relevant input, then distinguish sourced data from management estimates and formula-driven calculations. For example, a revenue assumption based on a 4% annual increase should state that it reflects the company’s experience over the prior three years. That context lets a reviewer judge whether the method suits the forecast.
Use cell comments to identify the source and clarify what an input represents. A comment can record a report name, publication date, page reference or the reason for a management estimate. For a loan schedule, document the 10% interest rate and 10-year duration alongside the loan terms. If the interest rate is an assumption rather than a contractual input, label it clearly. This distinction affects how the figure should be interpreted.
Keep worksheet references visible, too. Add the file path, page number and date to each worksheet’s footer. This helps reviewers identify the workbook and locate supporting material when sheets are printed or shared separately. Use consistent labels for units, periods and input types so forecast expenses cannot be mistaken for actual balances or calculated outputs.
For complex models, maintain an assumptions log recording each input, its source and rationale, and the worksheet it affects. Update the log when an investment case changes, and confirm dependent formulas still point to the intended cell. Comments alone can become outdated when assumptions move. A disciplined audit trail makes software-based review more useful because reviewers can follow the logic from source to output without guessing.
Keep source files in a consistent folder structure and use descriptive filenames, such as “Revenue forecast” followed by the reporting period. When an input changes, update its supporting reference and record the reason. This creates a clear trail from the original evidence through the model calculation to the reported result, helping reviewers distinguish an updated assumption from an unexplained change.
An Excel model is harder to review when one formula combines several operating drivers, lookups and adjustments. Break calculations into steps: link volume and price to revenue, calculate costs separately, then show how income flows into the balance sheet. Reviewers can then trace the method and identify which input drives a change in valuation. Keep each formula focused on one calculation, not several unrelated decisions.
Common mistakes include hiding assumptions inside formulas, using unexplained hardcodes and presenting outputs with unjustified precision. For example, a formula that multiplies revenue by a margin and subtracts an adjustment conceals the adjustment’s source. Put that input in a clearly labelled cell instead. Another mistake is showing a single scenario without explaining its assumptions. Separate inputs from calculations and make the selected case visible.
A factory example shows why the model should distinguish cash movement from accounting expense. A hypothetical $100 million factory purchase reduces cash flow by $100 million when acquired. If its useful life is 20 years, straight-line depreciation produces $5 million of annual expense on the income statement. Modelling the purchase and depreciation separately helps the balance sheet, income statement and cash flow statement reconcile. Combining them in one opaque formula can obscure both timing and financial effect.
Use the simplest method that represents the economics. A one-page DCF for a specific pitch can fit on one worksheet with fewer than 300 rows. A larger operating model may need separate schedules for revenue, working capital and debt, but each should have a clear purpose. Remove duplicate calculations, keep units consistent and use a check row to flag imbalances. The result stays useful without implying more precision than the assumptions support.
Start with the business decision, not a tour of the workbook. A clear explanation of how to present a financial model gives the discussion a useful sequence: establish the question, explain the model’s scope, then connect its findings to the action under consideration.
For a product-line expansion, show how the proposed launch flows through unit sales, pricing, production costs and required investment. Explain whether existing products remain in the forecast and how shared overhead is treated. This helps the audience understand the model’s boundaries before interpreting its outputs.
Keep the presentation and workbook aligned. Use the same case labels, period names and units in both so a question about a slide can be traced to the relevant worksheet without translation. Move detailed calculations into supporting material while keeping the main logic visible. If a discussion changes an input, state which output should respond and where that effect appears.
Close by separating the model’s conclusion from the decision itself. A forecast can show the financial consequences of expansion, while leadership weighs strategic fit, execution capacity and other considerations. This makes the analysis useful for decision support without presenting a spreadsheet output as the decision.
When building a discounted cash flow (DCF) analysis, the key challenge is making the link between forecast assumptions, cash flows and enterprise value clear to reviewers. A forecast can produce a valuation, but the result is difficult to assess if the model does not show how its inputs drive the output.
A DCF valuation converts forecast free cash flow into present value, then adds the present value of terminal value. The result depends on choices such as forecast drivers, discount rate and terminal value method. Presenting these inputs clearly helps reviewers understand what supports the valuation, rather than treating the final figure as an isolated answer. Explain which assumptions have the greatest influence and show how the model connects them to the result.
Make the calculation traceable in Excel: link forecast cash flows to the relevant operating assumptions, discount them using the selected rate, and calculate terminal value separately. Then check that the present value of forecast cash flows and terminal value reconcile to enterprise value. If a changed assumption produces an unexpected result, trace the formula links to identify where the effect enters the calculation.
Keep assumptions visible and distinguish model inputs from calculated outputs. This makes it easier to review the forecast, understand the effect of changes and explain the valuation in a model review or presentation. It also helps identify when the result depends heavily on a particular driver or terminal value method.
Explore the DCF & Valuation course for focused practice with DCF modelling in Excel.
Treat your next model review as a decision rehearsal. Before sharing the workbook, write the decision in one sentence and identify what evidence could change it. This shifts attention from polishing every cell to testing whether the analysis supports a real choice. A brief review with a colleague can reveal unclear outputs, gaps in the explanation or questions the summary leaves unanswered.
Use feedback to improve how the model guides a discussion, not just how it looks. A useful next step in learning how to present a financial model is to practise explaining one result and the decision it informs. Be direct, clarify the trade-offs and show the audience what to examine next.
Build that capability through practical financial modelling study. Explore FMU’s available courses and choose a learning path that fits the models you build.
Bring that discipline to your next review, and let clear analysis make your recommendations easier to act on.
Include a short model map so the audience can see where key calculations sit in the workbook. Identify the reporting currency, whether periods are monthly or annual, and the cut-off between actual results and forecast periods. If the presentation uses a different currency or period grouping from the source data, state the conversion or aggregation method. These details prevent confusion before anyone interprets the outputs.
Explain each assumption by naming its source, the model input it affects and the resulting business impact. For example, clarify whether a cost input applies per employee, per unit or as a fixed expense, rather than quoting a value without context. Distinguish inputs that can be updated directly from outputs calculated by formulas. This gives reviewers a precise way to discuss changes without confusing an assumption with a model result.
In Excel, make scenario selection explicit and ensure the chosen case updates the relevant inputs together. For a sensitivity table, select an output cell and vary only the inputs shown in its row and column. Label the table with the output’s units and the assumptions being tested. Before presenting it, change one input manually and confirm the table responds as intended, rather than relying on formatting alone.
Separate mechanical checks from forecast uncertainty. Mechanical checks can flag missing inputs, inconsistent signs, broken links and unexpected changes between periods. Explain limitations by naming what the model excludes, such as an unmodelled acquisition or a change in accounting policy, and describe how that exclusion affects interpretation. This helps the audience distinguish calculation issues from choices about the model’s scope.