

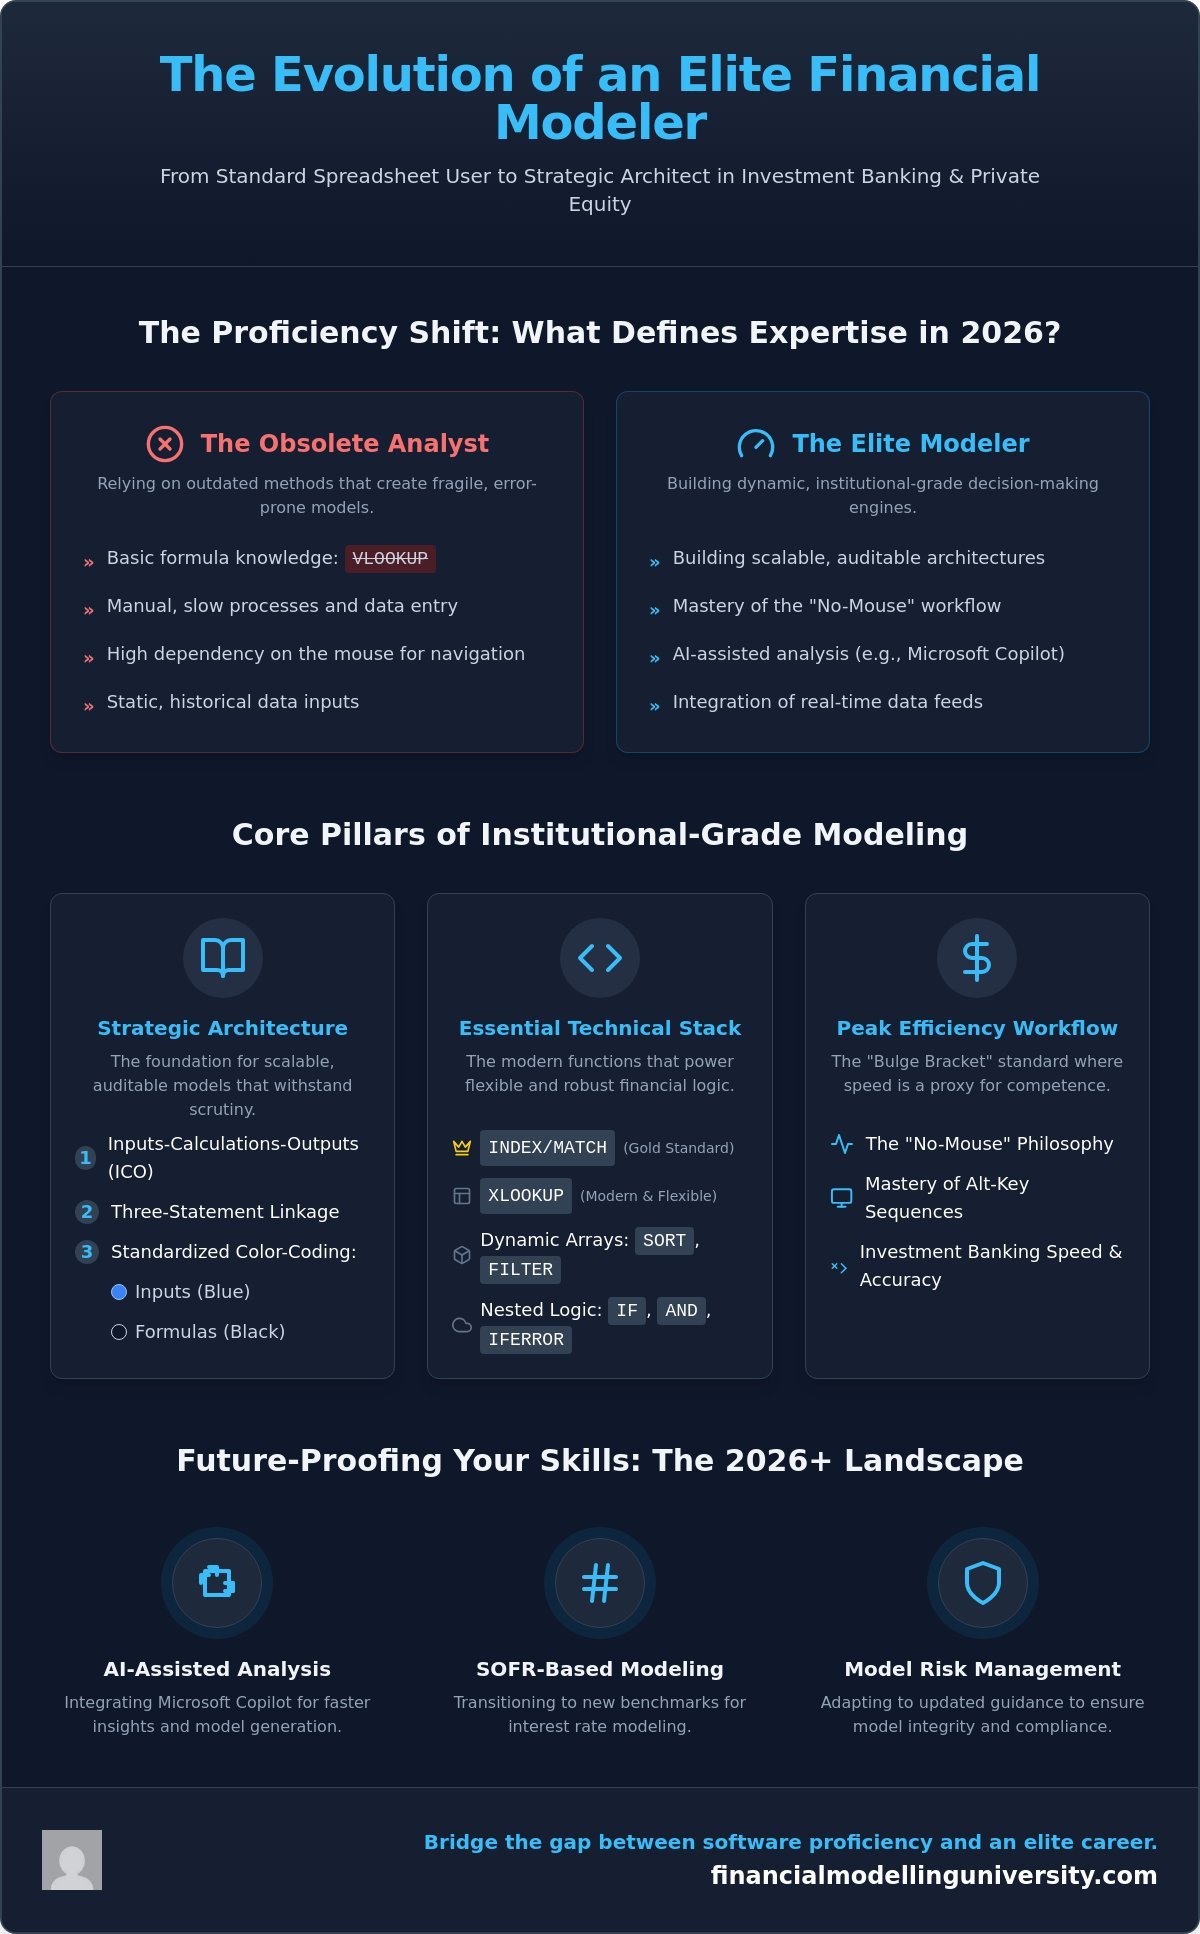
In 2026, knowing how to write a VLOOKUP doesn’t make you an expert; it makes you obsolete. Proficiency in excel for finance professionals has shifted from basic formula knowledge to the ability to build scalable, audited architectures that function as strategic decision-making engines. Most analysts still struggle with models that lack flexibility or crumble during high-stakes technical interviews, leaving them trailing behind peers who have mastered the “no-mouse” workflow. You likely feel the pressure to move faster, yet you’re held back by manual processes and the constant anxiety of a hidden error in your DCF.
We’re here to change that trajectory. This guide provides the blueprint to transform you from a standard user into an elite modeler capable of executing complex IB and PE valuations. At FMU, we’ve helped over 25,000 professionals master financial modeling like the pros through rigorous, real-world application. You’ll learn to build dynamic, error-free models that withstand the scrutiny of any investment committee or top-tier firm.
We will explore the integration of Microsoft Copilot for AI-assisted analysis, the transition to SOFR-based interest modeling, and the implications of the April 2026 updated model risk management guidance. From advanced M&A layering to institutional-grade DCF structures, you’re about to secure the technical edge required for the industry’s most prestigious roles.
Key Takeaways
- Transition from standard spreadsheet use to institutional-grade modeling by mastering the intersection of technical precision and financial theory.
- Master the technical stack essential for excel for finance professionals, including advanced XLOOKUP and INDEX/MATCH nesting to handle complex deal contingencies.
- Implement the Inputs-Calculations-Outputs (ICO) framework and industry-standard color-coding to build scalable, audited models for DCF and M&A valuations.
- Achieve peak efficiency by adopting a “no-mouse” workflow, utilizing specific Alt-key sequences to navigate ribbons and format with investment banking speed.
- Bridge the gap between software proficiency and elite career placement by training under industry insiders who have executed deals at top-tier firms.
Beyond the Spreadsheet: Why Excel for Finance Professionals is a Career Catalyst
Excellence in excel for finance professionals is the primary barrier between a junior analyst and a strategic leader. It isn’t just about using software; it’s the precise intersection of technical command and complex financial theory. While a general business user might use a spreadsheet for simple data tracking, the elite modeler builds a sophisticated decision-making engine. Understanding What is Financial Modeling? requires recognizing that every cell must reflect a rigorous accounting reality. In the high-stakes world of private equity or investment banking, your spreadsheet is your reputation. If the logic fails, the deal fails.
Standard “Business Excel” fails in these environments because it lacks the auditability and scalability required for multi-billion dollar transactions. Adhoc calculations are dangerous. They’re often prone to circular references and hard-coded errors that destroy a model’s credibility. By 2026, the technical shift is undeniable. Excel has evolved into a core engine integrated with real-time data feeds and AI-driven assistants like Copilot. This requires professionals to manage live streams of market data rather than static, historical inputs. Institutional-grade modeling demands a structured architecture where every assumption is transparent and every output is verifiable.
The Bulge Bracket Standard
Top-tier firms like Goldman Sachs or JP Morgan don’t just look for accuracy; they demand technical mastery that borders on the subconscious. The “No-Mouse” philosophy is the gold standard in these corridors. If you’re still reaching for your mouse to format a cell or navigate a ribbon, you’re seen as technically incompetent. Speed is a proxy for how well you know the tool. Professional models utilize strict formatting conventions, such as blue for inputs and black for formulas, ensuring any senior associate can audit the work instantly. This level of scalability and clarity is what separates a student from a pro.
Financial Logic vs. Tool Proficiency
A perfect formula in a poorly structured model is a liability. You can’t just be good at Excel; you must be an expert in the underlying finance. The three-statement linkage, connecting the Income Statement, Balance Sheet, and Cash Flow Statement, is the non-negotiable foundation of all elite work. Transitioning from simple data entry to a strategic analyst requires you to think in terms of spreadsheet architecture. You aren’t just filling cells; you’re building a dynamic representation of a company’s future. Mastery means knowing when to use a complex nested IF statement and when a simple, clean structure serves the deal better.
The Essential Technical Stack: Formulas and Functions for Elite Modeling
Institutional-grade modeling requires more than basic arithmetic. Elite excel for finance professionals involves building logic that’s both bulletproof and flexible. If you’re still relying on VLOOKUP, you’re building fragile models. Modern finance demands a more robust technical stack to handle the complexity of multi-layered capital structures and non-periodic cash flows. You must master the tools that allow for rapid sensitivity analysis and error-free scalability.
The 2026 Excel engine has transformed how we handle data. Dynamic arrays like SORT, FILTER, and UNIQUE have replaced clunky manual data cleaning. These functions allow you to create automated summaries that update instantly as deal parameters shift. When combined with logical nesting using IF, AND, OR, and IFERROR, you can build “switches” into your model. These switches handle various deal contingencies, such as different interest rate floors or cash-sweep triggers, without breaking the underlying architecture. If you want to bridge the gap between basic usage and professional mastery, our Excel for Finance Course provides the deep-dive training required for high-stakes environments.
Advanced Reference and Array Formulas
INDEX/MATCH remains the institutional gold standard for large-scale models. It’s more computationally efficient than XLOOKUP and offers superior flexibility when dealing with massive datasets. While OFFSET and INDIRECT can be used for dynamic scenario selection, use them with caution; they’re volatile functions that can slow down complex workbooks. Instead, focus on implementing dynamic headers and custom number formatting. These ensure your model isn’t just accurate but also presents with the professional clarity expected by an investment committee.
Financial Math and Logic Integration
Building flexible debt schedules is a core requirement for any LBO or project finance model. You must use complex conditional logic to ensure mandatory repayments and interest accruals react dynamically to available cash flow. In 2026, this means ensuring your interest calculations reference SOFR as the primary benchmark. XIRR provides the most accurate reflection of investor returns by accounting for the exact timing of irregular cash flows, which is why it’s the mandatory standard for private equity performance metrics. Mastery of XNPV and XIRR ensures your valuations reflect the true time value of money across non-periodic distributions.
Strategic Model Architecture: Structuring Data for DCF and M&A
Mastery of excel for finance professionals is defined by the architecture of the workbook, not just the complexity of the formulas. Elite modelers don’t just “build” spreadsheets; they design scalable engines. The gold standard for institutional work is the Inputs-Calculations-Outputs (ICO) framework. This structure separates hard-coded assumptions from the processing logic and the final reporting summaries. It ensures that any senior associate or auditor can trace the flow of data from a single growth rate assumption to the final enterprise value without getting lost in a maze of spaghetti code.
Auditability is the hallmark of a professional. This is why strict formatting conventions are non-negotiable. Use blue font for all hard-coded inputs and black font for formulas. If a cell links to another sheet, use green. These visual cues allow for instant verification of the model’s integrity. Furthermore, a strategic model must be dynamic. By building a dedicated scenario manager with toggles for Base, Upside, and Downside cases, you transform a static forecast into a powerful tool for risk assessment. This architecture allows you to stress-test a deal’s viability under various market conditions in seconds.
The Foundation: Linking the Three Statements
The three-statement model is the technical heartbeat of every investment banking deal. You must link the Income Statement, Balance Sheet, and Cash Flow Statement with absolute precision. This process requires handling circularity, specifically where interest expense depends on the debt balance, which in turn depends on the cash flow generated. You’ll need to enable iterative calculations and build robust “sanity checks.” If your Balance Sheet doesn’t balance to zero via an automated check, your model lacks credibility. Mastering this structural logic is the core focus of our Excel for Finance program, which serves as the prerequisite for high-level architectural design.
Valuation Engines: DCF and LBO Integration
Once your three-statement forecast is bulletproof, you can integrate your valuation modules. A professional Discounted Cash Flow (DCF) module should pull Unlevered Free Cash Flow directly from your forecast. Avoid hard-coding any values in the valuation section. Instead, use Data Tables to build sensitivity matrices that test your WACC and Terminal Value assumptions. In a private equity context, your architecture must also accommodate complex debt tranches and waterfall distributions. This ensures your LBO analysis reflects the true return profile for various equity holders. It’s this level of detail that separates a standard analyst from an elite financial modeler.
Peak Efficiency: Mastering the Keyboard and Model Integrity
Speed is the ultimate proxy for technical competence in high-stakes finance. For excel for finance professionals, the transition from a mouse-dependent user to a keyboard-only modeler is a mandatory rite of passage. If you’re reaching for a mouse during a modeling test or a live deal, you’re signaling that you haven’t mastered your primary tool. Removing the mouse forces you to internalize the ribbon structure, using Alt-key sequences to navigate formatting, alignment, and data tools with lightning precision. This efficiency doesn’t just save time; it reduces the risk of manual errors by keeping your focus on the logic rather than the interface.
Mastery also requires professional-grade auditing frameworks. You must use tools like ‘Trace Precedents’ and ‘Trace Dependents’ to map the DNA of your workbook. Understanding how a single revenue assumption flows through the three statements to the final valuation is critical for defending your work during a senior-level review. To reach this level of elite performance, you need a structured path that mirrors the intensity of a real deal. You can Master Financial Modeling Like the Pros by training on the exact workflows used at bulge bracket firms.
The Path to Keyboard Mastery
- Alt + H + O + I: Auto-fits column widths instantly to keep data readable.
- Ctrl + [ and Ctrl + ]: Navigates directly to precedents or dependents across different sheets.
- Alt + E + S + T: Pastes formats only, ensuring your visual standards remain consistent without overwriting logic.
Customizing your Quick Access Toolbar (QAT) is the secret weapon of the top 1% of analysts. By pinning your most frequent commands, like ‘Paste Values’ or ‘Trace Precedents’, to the top of your screen, you reduce multi-step sequences to a single Alt + [Number] command. F2, F4, and F9 are the holy trinity of model editing, allowing you to enter cells, toggle absolute references, and refresh calculations without ever breaking your flow. Mastering these shortcuts saves at least five hours per week, giving you the bandwidth to focus on strategic analysis rather than cell formatting.
Error-Proofing and Auditing Frameworks
Speed without integrity is a liability. You must build automated ‘Check Sheets’ that aggregate every sanity check in your model into a single, high-visibility dashboard. Use conditional formatting to highlight broken links, ‘DIV/0’ errors, or Balance Sheet imbalances in bright red. This ensures you catch failures before they reach a senior partner’s desk. In 2026, the role of VBA has shifted. Use macros for stable, repetitive tasks like formatting raw data feeds or cleaning large datasets, but keep your core financial logic transparent and manual to ensure it remains auditable by your investment committee.
Mastering Financial Modeling Like the Pros with FMU
Achieving elite status as excel for finance professionals requires more than watching generic tutorials. You need a structured, university-level experience that replicates the high-stakes environment of a live deal room. Financial Modelling University (FMU) exists to bridge the gap between basic software proficiency and institutional-grade execution. We don’t just provide video content; we provide a career-defining catalyst. By learning from industry insiders who have executed multi-billion dollar transactions at top-tier firms, you gain the “insider” perspective that standard business courses lack. This is where technical precision meets real-world application.
Our Investment Banking Financial Modeling Course is designed for those who refuse to settle for average performance. It focuses on the strategic architecture and “no-mouse” workflows required to survive a bulge bracket modeling test. In the 2026 job market, a globally recognized certification from FMU serves as a verified hallmark of your technical competence. It signals to recruiters that you possess the professional discipline and technical stack necessary for the industry’s most prestigious roles.
The FMU Curriculum Advantage
FMU provides direct access to downloadable institutional templates used in actual private equity and banking deals. These aren’t simplified exercises; they’re the complex engines used by the pros. You’ll participate in live Q&A sessions to resolve technical logic issues in real-time, ensuring you never get stuck on a circular reference again. Our one-to-one career mentoring helps you translate these excel for finance professionals skills into successful technical interviews. For those committed to total mastery, the FMU All-Access Pass offers a comprehensive path from foundational logic to advanced LBO and project finance modeling.
Transforming Your Career Trajectory
The results of our methodology are proven by the success of our graduates. We’ve helped over 25,000 professionals secure roles at elite firms by providing the blueprint for technical excellence. When you analyze the ROI of specialized financial modeling education against a traditional Master’s degree, the advantage is undeniable. You gain the exact, specialized edge that firms demand in a fraction of the time. Stop struggling with inefficient workflows and fragile spreadsheets. Enroll in our Financial Modeling Course Online today and master financial modeling like the pros.
Secure Your Technical Edge in 2026
The transition from a standard user to an elite modeler requires a fundamental shift in how you view the spreadsheet. It’s no longer just a calculation tool; it’s a strategic decision-making engine built on the ICO architecture. By mastering the keyboard-only workflow and institutional auditing frameworks, you eliminate the technical friction that holds most analysts back. The 2026 landscape for excel for finance professionals demands a deeper integration of dynamic arrays and robust error-proofing to survive the scrutiny of an investment committee.
The path to the top tier of investment banking and private equity is paved with technical precision. To truly excel, you need a curriculum that mirrors the intensity of real-world deals. Trusted by 25,000+ finance professionals, FMU provides the exact blueprint used by industry insiders to execute complex valuations. You’ll gain access to downloadable institutional-grade templates and expert mentorship that bridges the gap between software skill and career mastery.
Take the definitive step toward your professional transformation. Master Financial Modeling Like the Pros with FMU’s All-Access Pass and secure the prestige associated with elite industry performance. Your journey to technical mastery starts now.
Frequently Asked Questions
Is Excel still relevant for finance professionals in 2026 with the rise of AI?
Excel remains the foundational engine for all institutional deal-making. While Microsoft 365 Copilot assists with rapid data cleaning and initial analysis, the core logic and architectural design must be human-verified to meet the 2026 principles-based model risk management guidance. AI is a powerful productivity accelerator, but it cannot replace the strategic judgment or the audited transparency required for multi-billion dollar valuations.
What is the fastest way to learn ‘no-mouse’ Excel for investment banking?
The most efficient method is total immersion. Physically disconnect your mouse and commit to using Alt-key sequences for every ribbon command. Focus on mastering navigation shortcuts like Ctrl+Arrow keys and formatting sequences like Alt+H+O+I. This approach forces your brain to internalize the ribbon structure, which is a non-negotiable standard for excel for finance professionals at bulge bracket firms.
Do I need to learn VBA for financial modeling, or is Python better?
VBA remains the industry standard for internal model automation because it’s native to Excel and easily auditable by senior partners. Python is superior for massive data processing and high-volume quantitative research, but it lacks the seamless, cell-based transparency required for LBO and M&A modeling. Use VBA for workbook-specific tasks and Python for broader data science applications outside the core model.
What are the most important Excel formulas for a finance interview?
You must demonstrate mastery of advanced reference and financial math functions. Expect to use INDEX/MATCH or XLOOKUP for dynamic data retrieval and XIRR/XNPV for calculating returns on non-periodic cash flows. Be prepared to build complex conditional logic using nested IF statements to handle deal contingencies, such as debt cash sweeps or interest rate floors based on the current SOFR benchmark.
How does a financial modeling certification help my career?
A specialized certification serves as a verified hallmark of your technical competence in a saturated job market. It provides social proof that you can execute institutional-grade modeling without constant supervision. For elite firms, it functions as a critical filter to identify candidates who have already mastered the “Wall Street” standard, significantly reducing the firm’s internal training requirements.
What is the difference between a standard Excel course and an investment banking Excel course?
A standard course focuses on general tool proficiency, while an investment banking course focuses on strategic architecture and deal logic. IB-specific training emphasizes the Inputs-Calculations-Outputs (ICO) framework and strict formatting conventions like blue-for-inputs. It’s the difference between learning how to use a hammer and learning how to engineer a complex financial skyscraper.
Can I use Excel for Mac for professional financial modeling?
Excel for Mac remains a liability for professional modeling despite recent updates. Key keyboard shortcuts differ significantly from the Windows version, which is the universal standard in investment banking and private equity. Using a Mac during a technical interview or on a deal team will slow you down and create unnecessary friction with colleagues who expect Windows-based efficiency.
How do I build a sensitivity analysis table in Excel?
Sensitivity analysis is best executed through Data Tables (Alt+A+W+T). This tool allows you to test two variables simultaneously, such as WACC and Terminal Growth Rate, to see their direct impact on Enterprise Value. Ensure your table links to your valuation output and that your input assumptions are clearly defined within the ICO framework to maintain the integrity of your excel for finance professionals workflow.