

Businesses rely on data to make financial decisions, but raw numbers alone don’t reveal what comes next – this is where financial modeling becomes essential.
In this guide, you will learn what financial models are, how financial modeling works, and the 15 most common types of financial models used in corporate finance, investment banking, private equity and FP&A. If you want to learn how to build these models step-by-step, explore our financial modeling courses.
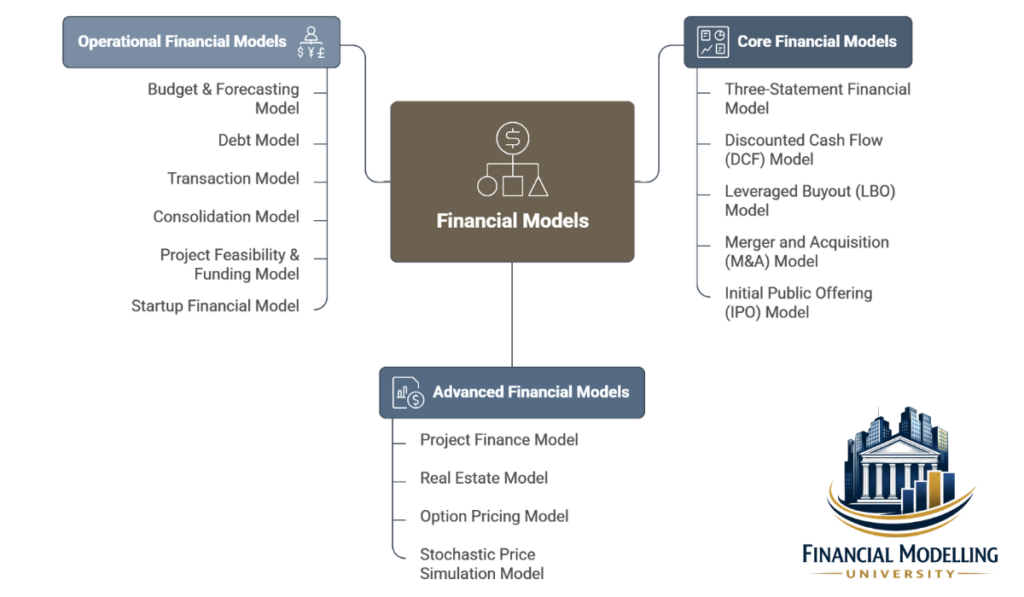
Types of Financial Models
The table below summarizes the most common types of financial models, their primary use, and when they are typically applied in corporate finance and investment analysis.
| Financial Model | Primary Use | Common Users | Typical Use Case |
| Three Statement Financial Model | Forecast financial statements | FP&A teams, analysts | Financial planning and analysis |
| Discounted Cash Flow Model | Company valuation | Investment bankers, investors | Valuing businesses or projects |
| Leveraged Buyout Model | Analyze debt financed acquisitions | Private equity firms | Buyout analysis |
| Merger and Acquisition Model | Evaluate mergers between companies | Investment bankers | Deal analysis |
| Initial Public Offering Model | Estimate company value before going public | Investment bankers and Corporate finance teams | IPO preparation |
| Project Finance Model | Evaluate large infrastructure investments | Banks, project sponsors | Project funding analysis |
| Real Estate Model | Evaluate real estate investments across multi layers of assets | Investment bankers, investors | Project funding analysis |
| Option Pricing Model | Value financial derivatives | Risk Investment Professionals | Options valuation |
| Stochastic Price Simulation Model | Value Cryptocurrency and commodity prices | Investment Professional | Uncertainty Investment Valuation |
| Budget & Forecasting Model | Detailed planning forecast and future performance | FP&A and Finance Team | Annual budgeting & Strategic planning |
| Debt Models | Plan debt forecasting using one or multiple financial facilities | Banks, project sponsors | Project funding analysis |
| Transaction Model | Value a company based on peer multiples and transactions | Investment bankers and Private Equity Proefessionals | Market based valuation & Deal pricing |
| Consolidation Model | Combine financial statements of subsidiaries | Corporate finance teams | Group financial reporting |
| Project Feasibility & Funding Model | Evaluate if greenfield or brownfield investments are and financially viable | Consulting houses, Investment firms, and venture capital firms | Project planning and funding analysis |
| Startup Financial Model | Forecast startup growth and new investments funding needs | Founders, venture capital firms | Startup planning |
The following sections explain these financial models in more detail and show when each model is most useful in financial analysis and decision-making.
15 Types of Financial Models Explained
1. Three Statement Financial Model
The three statement financial model links the three core financial statements of a company: the income statement, balance sheet, and cash flow statement. These statements are calculated based on assumptions, so that changes in one assumption affect all three statements.
This model is often the foundation of financial modeling because it provides a complete view of a company’s financial performance. Investment professional use it to project revenue, expenses, balance sheet position, and cash flow over time.
When to use it
- Forecasting company performance
- Building long term financial projections
- Supporting budgeting and strategic planning
Example
Investment professional forecasts higher revenue growth, which increases net income on the income statement. Higher net income increases retained earnings on the balance sheet and affects the cash balance on the cash flow statement.
2. Discounted Cash Flow (DCF) Model
The discounted cash flow model estimates the value of a company or investment based on expected future cash flows using a discount rate (Weighted Average Cost of Capital “WACC”) which is estimated based on the company’s business and risks. These cash flows are discounted back to their present value, typically including a ‘Terminal Value’ to capture the company’s worth beyond the explicit forecast period. Refer to the DCF & Valuation Course for more details.
The DCF model is widely used along with transactional method (Comparables and Precedent Transactions) to evaluate the company’s value under multiple methods.
When to use it
- Valuing companies for investment decisions
- Evaluating potential acquisitions
- Assessing long term investment projects
Example
An investor projects a company’s cash flows for the next five years and estimates a terminal value. These future cash flows are discounted using the weighted average cost of capital to estimate the company’s current value.
3. Leveraged Buyout (LBO) Model
The leveraged buyout model analyzes the acquisition of a company using a significant amount of borrowed capital. Private equity firms often use this model to determine whether the cash flows of a target company can support the debt used to finance the acquisition.
The model projects future revenue, operating performance, and debt repayment to estimate the potential return on investment. Refer to the LBO Course for more details.
When to use it
- Evaluating buyout opportunities
- Analyzing debt financed acquisitions
- Estimating potential returns for private equity investors
Example
A private equity firm acquires a company using a combination of equity and debt. The model forecasts future cash flows to determine whether the business can repay the debt and generate returns when the firm exits the investment.
4. Merger and Acquisition (M&A) Model
The model analyzes factors such as purchase price, financing structure, cost synergies, and revenue synergies. This method is often used by investment firms to evaluate the impact of M&A on their portfolio.
When to use it
- Evaluating merger opportunities
- Analyzing acquisition deals
- Assessing the financial impact of corporate transactions
Example
An acquiring company estimates cost savings and revenue synergies after acquiring an investment. The model projects the combined company’s financial performance and calculates the accretion and dilution of the new value post M&A.
5. Initial Public Offering (IPO) Model
The IPO model estimates the value of a company that plans to go public. Analysts use this model to determine an appropriate share price and evaluate how the offering will affect the company’s capital structure.
The model compares the company with publicly traded peers and projects future financial performance to support valuation.
When to use it
- Preparing for an initial public offering
- Estimating potential share price ranges
- Evaluating market conditions before listing
Example
A company planning to go public projects revenue growth and profitability over several years. Analysts compare valuation multiples with similar public companies to estimate a potential IPO price.
6. Project Finance Model
The project finance model evaluates large investment projects such as infrastructure, energy, or real estate developments. These models analyze whether projected cash flows from the project can support the required financing.
Banks and investors often rely on project finance models to evaluate risk before providing capital.
When to use it
- Evaluating infrastructure projects
- Assessing long term investment feasibility
- Structuring project financing agreements
Example
A renewable energy project forecasts electricity production and revenue over the life of the project to determine whether it can repay the loans used to finance construction.
7. Real Estate Model

Real estate models are used to evaluate the financial performance and investment returns of property developments and income-generating real estate assets. These models estimate the expected revenue, operating costs, financing structure, and exit value of a property investment over a defined holding period.
A real estate model typically forecasts rental income, vacancy rates, operating expenses, capital expenditures, and property appreciation. It also incorporates financing assumptions such as mortgage loans, construction loans, and mezzanine financing to determine the leverage structure and calculate the returns to investors.
These models are widely used by real estate developers, private equity real estate funds, investment firms, and lenders to assess the feasibility and profitability of real estate investments.
Real estate models generally fall into two main categories:
- Development Models – used to analyze ground-up construction projects or major redevelopment projects. These models estimate development costs, construction timelines, lease-up periods, and stabilized property value.
- Acquisition Models – used to evaluate the purchase of an existing income-generating property. These models forecast rental income, operating expenses, and the potential resale value of the property at the end of the investment horizon.
A key component of real estate modeling is estimating the Net Operating Income (NOI) generated by the property. NOI represents the income produced by the property after operating expenses but before financing costs and taxes.
Real estate models also estimate property value using the capitalization rate (cap rate) approach. The cap rate represents the relationship between a property’s NOI and its market value and is commonly used to estimate the resale or exit value of the asset.
Investment professionals evaluate the attractiveness of a real estate investment using metrics such as Internal Rate of Return (IRR), Equity Multiple, Cash-on-Cash Return, and Net Present Value (NPV).
When to use it
- Evaluating real estate development projects
- Assessing acquisitions of income-producing properties
- Analyzing property investment returns for real estate funds or developers
- Determining optimal financing structures for real estate investments
Example
A real estate investment firm builds a financial model to evaluate the development of a mixed-use property that includes residential apartments and retail space. The model forecasts construction costs, rental income, operating expenses, and financing costs, and estimates the expected investor returns over a 10-year holding period based on projected property value appreciation and exit cap rates.
Option Pricing models are used to estimate the fair value of financial options and other derivative instruments whose value depends on the price of an underlying asset. These models help investors and analysts measure the economic value of the right, but not the obligation, to buy or sell an asset at a predetermined price within a specified period.
8. Option Pricing Model
An Option Pricing model typically evaluates key variables such as underlying asset price, exercise price, time to maturity, volatility, risk-free interest rate, dividend yield, and option type. Based on these inputs, the model estimates the value of the option and helps users understand how changes in market conditions affect the option’s price.
These models are widely used in investment banking, asset management, hedge funds, corporate finance, risk management, and valuation advisory. They are particularly important when valuing stock options, warrants, convertible securities, employee stock options, structured products, and embedded derivatives.
The most common approaches used in Option Pricing models include:
- Black-Scholes Model – a widely used closed-form model for valuing European-style options
- Binomial Tree Model – a flexible method that values options through multiple possible price paths and is often used for American-style options
- Simulation-Based Approaches – used for more complex derivatives or situations where payoffs depend on multiple variables or scenarios
A key strength of Option Pricing models is that they capture the value of uncertainty and flexibility. Unlike traditional valuation methods that focus only on expected cash flows, option pricing recognizes that volatility, timing, and strategic choice can have economic value.
These models are also used in broader finance applications beyond traded options. For example, they may be applied to real options analysis, where an investment opportunity is valued based on the flexibility to delay, expand, contract, or abandon a project in the future.
Investment professionals often use Option Pricing models to evaluate measures such as option premium, intrinsic value, time value, implied volatility, and sensitivity metrics such as delta, gamma, theta, vega, and rho.
When to use it
- Valuing stock options, warrants, and convertible securities
- Analyzing derivatives and structured financial instruments
- Measuring the impact of volatility and time on investment value
- Applying real options analysis to strategic investment decisions
Example
An investment professional builds an Option Pricing model to estimate the fair value of employee stock options granted by a technology company. The model uses the company’s current share price, exercise price, expected volatility, risk-free rate, and option life to estimate the value of the options for financial reporting and valuation purposes.
9. Stochastic Price Simulation Model
Stochastic Price Simulation models are used to evaluate investment outcomes under uncertainty by simulating a large number of possible future price paths for highly volatile assets such as cryptocurrencies, gold, oil, and other traded commodities. Rather than relying on a single forecast, this model produces a range of possible outcomes based on probability-driven assumptions.
The model is designed to capture the uncertainty and volatility of market prices by using statistical inputs such as expected return, price volatility, correlation, mean reversion, drift assumptions, and probability distributions. It generates multiple simulated scenarios to assess how asset prices may evolve over time and how those movements may affect investment returns, portfolio value, downside risk, and potential upside.
This type of model is particularly useful for assets whose prices are highly sensitive to market sentiment, macroeconomic conditions, geopolitical events, monetary policy, supply-demand imbalances, and speculative trading behavior.
Stochastic Price Simulation models are widely used by investment professionals, hedge funds, commodity traders, risk managers, and portfolio managers to analyze risk-adjusted returns and quantify uncertainty in volatile markets.
A key strength of this model is that it does not present valuation as a single-point estimate. Instead, it provides a distribution of outcomes, allowing analysts to evaluate metrics such as expected return, Value at Risk (VaR), downside scenarios, probability of loss, and probability-weighted investment performance.
These models are especially useful when analyzing assets such as:
- Cryptocurrencies – where prices are highly volatile and influenced by sentiment, liquidity, regulation, and adoption trends
- Gold – where prices are often driven by inflation expectations, real interest rates, central bank activity, and safe-haven demand
- Oil – where prices are affected by supply constraints, OPEC decisions, global demand, geopolitical risk, and inventory dynamics
When to use it
- Evaluating investments in highly volatile or uncertain asset classes
- Measuring downside risk and upside potential across multiple price scenarios
- Stress testing portfolio exposure to commodities or digital assets
- Supporting trading, hedging, and risk management decisions
Example
An investment professional builds a Stochastic Price Simulation model to evaluate a portfolio allocation to Bitcoin, gold, and crude oil. The model simulates thousands of future price paths based on historical volatility, correlation, and market assumptions, then estimates the range of possible portfolio returns, the probability of loss, and the downside risk under stressed market conditions.
10. Budget & Forecasting Model
Budget and Forecasting models help organizations plan expected financial performance and regularly compare it with actual results as new data becomes available and business conditions evolve. These models allow management to monitor progress, control costs, and adjust expectations throughout the year.
The model is used to project revenue, expenses, and financial targets for a specific period, typically one fiscal year, while incorporating historical performance and forward-looking assumptions. It helps companies allocate resources efficiently and monitor financial performance against planned objectives. Unlike a static budget, a Budget and Forecasting model is updated periodically to reflect new information and revised business expectations.
Budget models are commonly used in Financial Planning & Analysis (FP&A) to support financial planning, internal reporting, and management decision-making.
When to use it
- Annual budgeting processes and rolling financial forecasts
- Internal financial planning and updating financial projections
- Planning costs and monitoring business performance throughout the year
Example
A company prepares a financial budget projecting expected sales, operating expenses, and capital expenditures for the upcoming fiscal year. Actual results are then compared with the budget on a monthly or quarterly basis to evaluate performance and revise future forecasts.
11. Debt Model
Debt models are used to structure, analyze, and forecast the financing of a business or project through borrowed capital. These models estimate how debt is raised, serviced, and repaid over time while assessing the impact of financing on cash flow and investor returns.
A debt model typically includes detailed calculations for loan drawdowns, interest expenses, principal repayments, debt balances, and financial covenant compliance. It also evaluates the borrower’s ability to service debt using financial metrics such as Debt Service Coverage Ratio (DSCR), Loan Life Coverage Ratio (LLCR), leverage ratios, and interest coverage ratios.
Debt models often incorporate multiple financing facilities, each with different terms, repayment structures, and levels of risk. These facilities may include:
- Senior Debt
- Mezzanine Debt
- Standby Debt / Standby Facilities
- Revolving Credit Facilities (RCF)
- Subordinated Debt
- Bullet Loans
- Bridge Financing
In many investment transactions, particularly in project finance and leveraged acquisitions, the amount of debt that can be raised is determined through debt sizing analysis. Debt sizing estimates the maximum borrowing capacity of a project or company based on projected cash flows and lender requirements. Lenders typically use coverage ratios such as DSCR and LLCR to determine the amount of debt that the project can safely support.
Debt models may also include reserve accounts, which are required by lenders to reduce financing risk. Common reserve accounts include:
- Debt Service Reserve Account (DSRA)
- Maintenance Reserve Account (MRA)
- Liquidity Reserve Accounts
These mechanisms help ensure that the borrower maintains sufficient liquidity and meets lender requirements throughout the life of the financing.
Debt models are particularly important in project finance, leveraged buyouts (LBOs), infrastructure investments, and capital-intensive industries, where the capital structure significantly affects investment returns.
When to use it
- Structuring financing for infrastructure and project finance investments
- Evaluating leveraged buyouts and debt-funded acquisitions
- Assessing the sustainability of a company’s capital structure
- Forecasting interest payments, principal repayment schedules, and covenant compliance across multiple debt facilities
Example
A financial model developed for a large infrastructure project uses a combination of senior project finance debt, mezzanine financing, and a standby liquidity facility. The model estimates the maximum debt capacity using DSCR constraints, sculpts the repayment schedule based on projected project cash flows, and incorporates a DSRA to ensure that debt service obligations can be met throughout the project’s operating life.
12. Transactional Model
Transactional models estimate the value of a company using market-based valuation approaches, primarily Comparable Company Analysis (Comps) and Precedent Transaction Analysis.
Comparable Company Analysis values a business by comparing its financial metrics and valuation multiples with those of similar publicly traded companies. Precedent Transaction Analysis uses historical mergers and acquisitions involving similar companies to estimate valuation multiples observed in comparable transactions.
These methods are commonly used alongside Discounted Cash Flow (DCF) valuation to evaluate a company’s value under multiple approaches. The results are often presented using a football field chart, which illustrates the valuation ranges produced by different methodologies.
Investment professionals typically analyze financial metrics such as Revenue, EBITDA, EBIT, or earnings multiples to determine valuation benchmarks.
This approach reflects how the market values similar businesses and how comparable transactions have been priced in recent M&A activity.
When to use it
- Performing market-based valuation and estimating acquisition prices
- Supporting investment banking advisory and M&A negotiations
- Comparing companies operating within the same industry
Example
An investment professional compares a company’s valuation multiples with those of publicly traded competitors and with multiples observed in recent acquisitions within the same industry to estimate a reasonable market valuation range.
13. Consolidation Model
Consolidation models allow companies with multiple subsidiaries or business units to report their financial performance as a single combined entity.
In these models, financial projections for each subsidiary or business unit are prepared separately and then aggregated into a consolidated financial view representing the entire corporate group. This structure enables users to analyze both individual business unit performance and total group performance within the same financial model.
The consolidation model combines the financial statements of the parent company and its subsidiaries into a single set of consolidated financial statements. This approach helps organizations understand the overall financial position, operating performance, and cash flow generation of the entire corporate group.
Consolidation models are widely used by companies operating across multiple business lines or geographic regions, and they are particularly useful for diversified companies and conglomerates. In valuation contexts, this approach is often referred to as a Sum-of-the-Parts (SOTP) analysis.
When to use it
- Valuing conglomerates or diversified companies
- Analyzing performance across multiple business units or subsidiaries
- Evaluating potential spin-offs, restructurings, or divestitures
Example
An investment professional values a company’s technology division, manufacturing division, and retail division individually, using separate financial forecasts. The values of each division are then combined to estimate the total valuation of the company.
14. Project Feasibility & Funding Model
Project Feasibility and Funding models are used to evaluate whether a new business, project, or investment opportunity is commercially, operationally, and financially viable. These models help investors, lenders, venture capital firms, and project sponsors determine whether a project can generate sufficient returns and whether it is suitable for external funding.
A Project Feasibility and Funding model typically assesses the project’s revenue potential, cost structure, capital expenditure requirements, operating expenses, working capital needs, funding requirements, profitability, cash flow generation, and investor returns. It is designed to test whether the project can succeed under realistic assumptions and whether the economics support investment.
These models can be applied across a wide range of industries, including renewable energy, infrastructure, real estate, healthcare, manufacturing, technology, logistics, education, agriculture, and consumer businesses. The structure of the model may vary by sector, but the core objective remains the same: to determine whether the project is feasible and investable.
Project Feasibility and Funding models are widely used in venture capital, private equity, project finance, corporate investment, strategic planning, and fundraising processes. For early-stage businesses, the model is often used to support equity fundraising by demonstrating the business case, growth potential, cash burn profile, and expected return to investors. For more traditional projects, it is used to assess bankability, debt capacity, and overall economic attractiveness.
A key feature of this model is that it combines operational assumptions with funding strategy. It does not only show whether a project is profitable, but also whether it can be financed efficiently through equity, debt, grants, convertible instruments, or blended capital structures.
Investment professionals often use this model to evaluate metrics such as Internal Rate of Return (IRR), Net Present Value (NPV), payback period, EBITDA margins, cash burn, break-even timing, debt serviceability, and funding gap requirements.
When to use it
- Evaluating whether a new project or business idea is financially viable
- Supporting fundraising discussions with venture capital investors, lenders, or strategic investors
- Assessing capital requirements and funding gaps before project launch
- Testing different operating scenarios, cost assumptions, and funding structures
Example
An investor developing an agritech platform builds a Project Feasibility and Funding model to assess its commercial potential and funding needs over the next ten years. The model forecasts customer growth, pricing, operating costs, hiring needs, capital expenditure, and cash burn, then determines how much equity funding is required, when the business reaches break-even, and what return profile could be achieved by venture capital investors.
15. Startup Financial Model
Startup financial models focus on projecting revenue growth, funding needs, and operating costs for early stage companies. These models help founders and investors evaluate business viability and capital requirements.
They often emphasize customer acquisition, pricing strategies, and burn rate.
When to use it
- Planning startup growth
- Preparing investor presentations
- Estimating funding requirements
Example
A startup estimates monthly customer growth, subscription revenue, and operating costs to calculate how long existing funding will last.
Financial Modeling Techniques
Financial modeling relies on several analytical techniques that help analysts build accurate projections and evaluate business performance. These techniques determine how assumptions are translated into financial forecasts and how different scenarios are tested.

Top Down Modeling
Top down modeling starts with a broad market estimate and then narrows the analysis to a specific company. Analysts begin by estimating the total size of a market and then calculate the share a company might capture.
This approach is often used when market level data is available but detailed company level data is limited.
Example
An analyst estimates the total market size for a software industry at $10 billion. If a company is expected to capture 5 percent of the market, projected revenue would be $500 million.
Bottom Up Modeling
Bottom up modeling builds financial projections using detailed operational drivers. Instead of starting with market size, analysts estimate revenue based on individual factors such as units sold, pricing, or customer growth.
This approach is typically more accurate because it relies on specific business activities rather than broad assumptions.
Example
A company sells 10,000 units of a product at an average price of $40. The model estimates revenue by multiplying units sold by price.
Revenue = 10,000 × $40 = $400,000

Scenario Analysis
Scenario analysis evaluates how different sets of assumptions affect financial outcomes. Analysts typically create several scenarios such as best case, base case, and worst case projections.
This technique helps decision makers understand the potential range of outcomes under different economic or business conditions.
Example
A company models three revenue growth scenarios: 15 percent growth in the best case, 10 percent in the base case, and 5 percent in the worst case.
Sensitivity Analysis
Sensitivity analysis measures how changes in one variable affect the results of a financial model. Analysts adjust a single assumption, such as revenue growth or operating costs, while keeping other variables constant.
This technique identifies which factors have the greatest impact on profitability or valuation.
Example
An analyst tests how changes in revenue growth from 8 percent to 12 percent affect projected company valuation.
FAQs
If you want to build these skills for roles in investment banking, FP&A, or corporate finance, explore our financial modeling career tracks.


7 Responses