
Every deal memo, credit agreement, and M&A model has one metric in common: EBITDA. Analysts use it to price acquisitions, set debt covenants, and benchmark performance across entire industries.
The EV/EBITDA multiple is the most widely used valuation ratio in comparable company analysis, with sector averages ranging from roughly 7x in traditional industries to over 28x in software. Yet many people who use the term daily cannot explain why depreciation gets added back, or when the metric quietly misleads.
We will now explain what EBITDA is, how to calculate it two ways, how it flows into valuation, and where it breaks down.
What Exactly Is EBITDA?
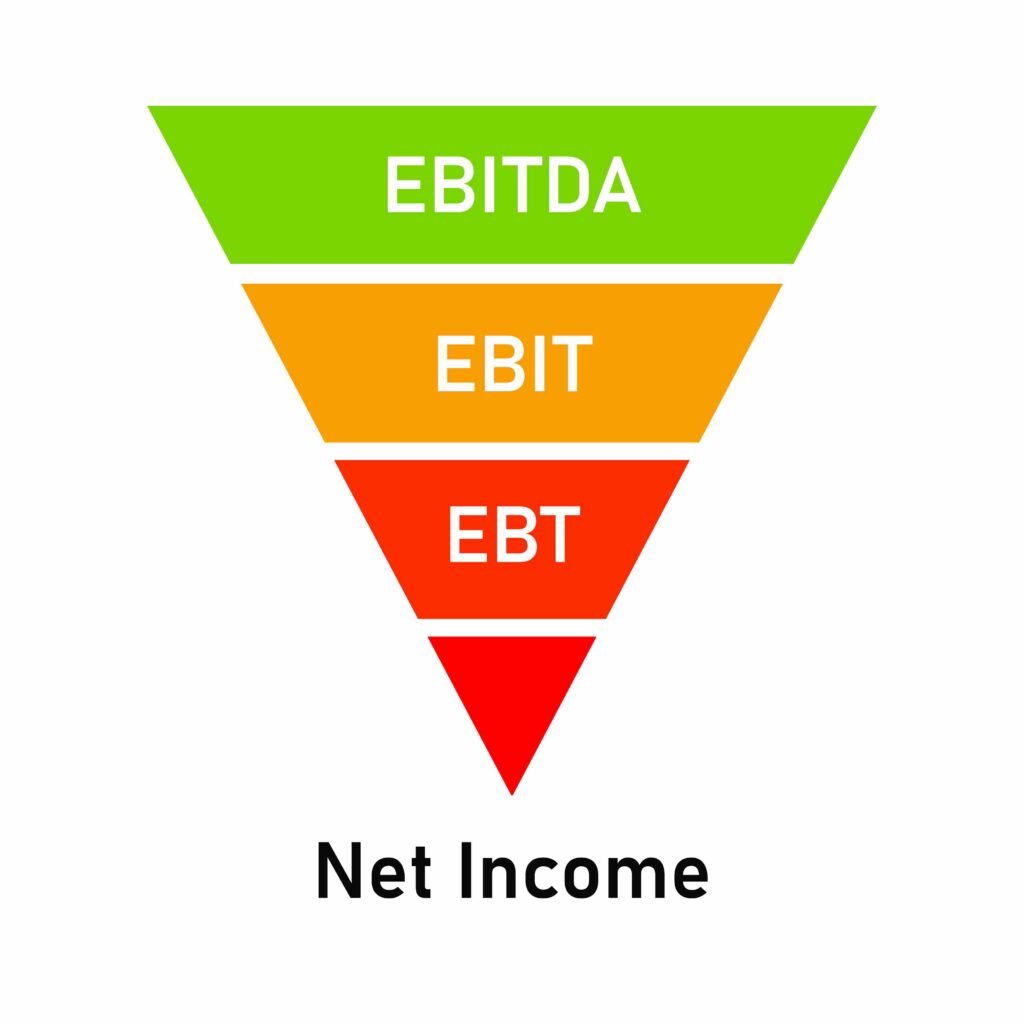
EBITDA stands for Earnings Before Interest, Taxes, Depreciation, and Amortization.
It measures a company’s operating profitability before the impact of financing decisions, tax environments, and non-cash accounting charges. The goal is comparability. Two companies in the same industry may carry very different debt loads, operate in different tax jurisdictions, or have made different accounting choices around asset depreciation. EBITDA strips those differences out, leaving a cleaner view of core operating performance.
It is a non-GAAP (and non-IFRS) metric. Companies calculate and disclose it voluntarily, which matters when you get to the limitations section below.

The Formula: Two Approaches
It can be calculated starting from two different points on the income statement. Both arrive at the same result.
| Approach | Formula |
| Top-down (from EBIT) | EBITDA = EBIT + Depreciation + Amortization |
| Bottom-up (from Net Income) | EBITDA = Net Income + Interest + Taxes + Depreciation + Amortization |
When to use which: The top-down approach is faster when EBIT is readily available on the income statement. The bottom-up approach is standard when building a financial model from scratch, since it starts from net income and adds back each excluded item individually. Depreciation and amortization figures should ideally be sourced from the cash flow statement or supporting disclosures to ensure accuracy.
Worked Example
Consider a fictional company, Nordhaven Industrial, with the following annual financials:
| Line Item | Amount |
| Revenue | $50,000,000 |
| Net Income | $4,200,000 |
| Interest Expense | $800,000 |
| Tax Expense | $1,400,000 |
| Depreciation & Amortization | $2,600,000 |
| EBITDA | $9,000,000 |
Using the bottom-up formula: $4,200,000 + $800,000 + $1,400,000 + $2,600,000 = $9,000,000
Using the top-down formula: EBIT = Net Income + Interest + Taxes = $6,400,000. Then add Depreciation to EBIT $6,400,000 + $2,600,000 = $9,000,000
Same result, different starting point.
How It Is Used in Valuation
Beyond being a profitability metric, EBITDA serves as the denominator in the most widely used valuation multiple in practice: EV/EBITDA.
The EV/EBITDA Multiple

Enterprise Value (EV) represents the total value of a business, typically calculated as market capitalisation/Equity Value plus net debt (and, where relevant, minority interest and preferred equity). Dividing EV by EBITDA tells you how many times EBITDA an acquirer is paying for the business.
EV/EBITDA = Enterprise Value / EBITDA
It is capital structure-neutral, which makes it far more useful for cross-company comparisons than the price-to-earnings (P/E) ratio. EV/EBITDA is the go-to metric in comparable company analysis (comps), leveraged buyout (LBO) models, and M&A due diligence.
Benchmark ranges to know:
| Context | Typical EV/EBITDA Range |
| Private companies | 4x – 7x |
| Public companies (broad market) | 8x – 14x |
| Technology / software | 15x – 30x+ |
| Capital-intensive industrials | 5x – 9x |
[/su_table]
These are directional benchmarks, not rules. Always compare within the same industry and time period.
LTM vs. NTM EBITDA

One distinction that rarely appears in basic EBITDA guides is which EBITDA analysts actually use in valuation.
- LTM EBITDA (Last Twelve Months): Based on the most recent four quarters of actual results. Used when historical performance is the most reliable data available, such as in credit analysis or private company transactions.
- NTM EBITDA (Next Twelve Months): A forward-looking estimate built from analyst projections or management guidance. Used in public equity valuation and strategic M&A, where buyers are pricing future performance, not past results.
Using the wrong time period in a comparable company analysis produces misleading multiples. If your comps use NTM and your target company uses LTM, the comparison is not valid.
Credit Analysis

Lenders frequently use EBITDA as the denominator in leverage ratios, the most common being Total Debt / EBITDA. In many cases, ratios around 3x–4x may be consistent with investment-grade profiles, depending on the sector, stability of cash flows, and lender criteria.
Covenant thresholds are often set relative to EBITDA, which is why the metric appears directly in loan agreements and bond indentures.
Margin
EBITDA margin expresses EBITDA as a percentage of revenue.
EBITDA Margin = EBITDA / Revenue
Using the Nordhaven example above: $9,000,000 / $50,000,000 = 18% EBITDA margin
Margins vary significantly by industry. Software businesses can run EBITDA margins above 30%. Grocery retailers may run at 4–6%. Comparing margins only makes sense within the same sector.
Where EBITDA Misleads: The Limitations

This is useful precisely because it simplifies. That simplification also makes it easy to abuse. Here is where analysts should apply extra scrutiny:
- Capital-intensive industries. In manufacturing, mining, oil and gas, or infrastructure, depreciation is not an accounting abstraction. It represents real wear on assets that must eventually be replaced.Even when depreciation is added back, it does not necessarily reflect the actual capital expenditure required to maintain the asset base. In many industries, maintenance capex can exceed accounting depreciation, further widening the gap between EBITDA and true cash generation. Warren Buffett made this point bluntly: “Trumpeting EBITDA is a particularly pernicious practice. Doing so implies that depreciation is not truly an expense. That’s nonsense.”
- High working capital businesses. It ignores changes in receivables, inventory, and payables. A business with growing EBITDA but deteriorating working capital may be generating far less actual cash than the headline number suggests.
- Growth companies with heavy capital expenditure. Sustaining growth requires real cash outflows. It does not reflect capex, so a company investing heavily in its future will show higher EBITDA than its true free cash flow generation warrants.
- Adjusted EBITDA. Companies are free to add back items beyond D&A: restructuring charges, stock-based compensation, one-time legal costs, and more. There are no accounting standards governing what qualifies. Always read the reconciliation table in any disclosure carefully. The gap between reported EBITDA and adjusted EBITDA is often significant. In practice, ‘Adjusted EBITDA’ is often the primary figure used in transactions. However, adjustments can be aggressive and subjective, particularly in private equity contexts. Analysts should scrutinize each adjustment and distinguish between truly non-recurring items and recurring ‘one-offs’
EBITDA vs. EBIT: A Quick Note
EBIT (Earnings Before Interest and Taxes) is simply EBITDA minus depreciation and amortization. For capital-light businesses, the difference is small. For capital-intensive companies, it is large. Analysts working in sectors like infrastructure, heavy manufacturing, or oil and gas often prefer EBIT because it better reflects the real cost of using physical assets.
Frequently Asked Questions
Conclusion
This is a powerful tool for comparing operating performance across companies with different capital structures, tax environments, and accounting policies. In valuation, EV/EBITDA is the standard comparable company metric. Knowing whether you are working with LTM or NTM EBITDA, and why it matters, separates analysts who use the metric correctly from those who do not.
Understanding the formula is the first step. Knowing when EBITDA is an appropriate proxy and when it materially distorts economic reality is what differentiates strong analysts.
Want to go deeper? At Financial Modelling University, our courses cover EBITDA in the full context of financial modelling, including how to build LBO models, run comparable company analysis, and stress-test valuation assumptions the way practitioners do. Explore the courses here.