

At 2 AM on a Tuesday, a junior analyst at a bulge-bracket bank discovered a $150 million valuation error in his DCF. The culprit? A single, poorly structured circular reference in the debt schedule, a common pitfall in amateur excel financial modeling that went unnoticed for 48 hours. It’s a scenario that keeps even seasoned associates awake at night; you know the line between a ‘good enough’ model and an institutional-grade build is razor-thin, and that a single mistake can undermine an entire thesis.
This guide is engineered to eliminate that risk. You will master the architecture, logic, and best practices that separate elite analysts from the pack. We’ll show you how to build a robust three-statement model from scratch, master the advanced shortcuts that can double your efficiency, and gain the unshakeable confidence to pass any modeling test thrown your way. We will deconstruct the entire process, from setting up a bulletproof framework to executing complex valuation analyses with precision and speed.
Key Takeaways
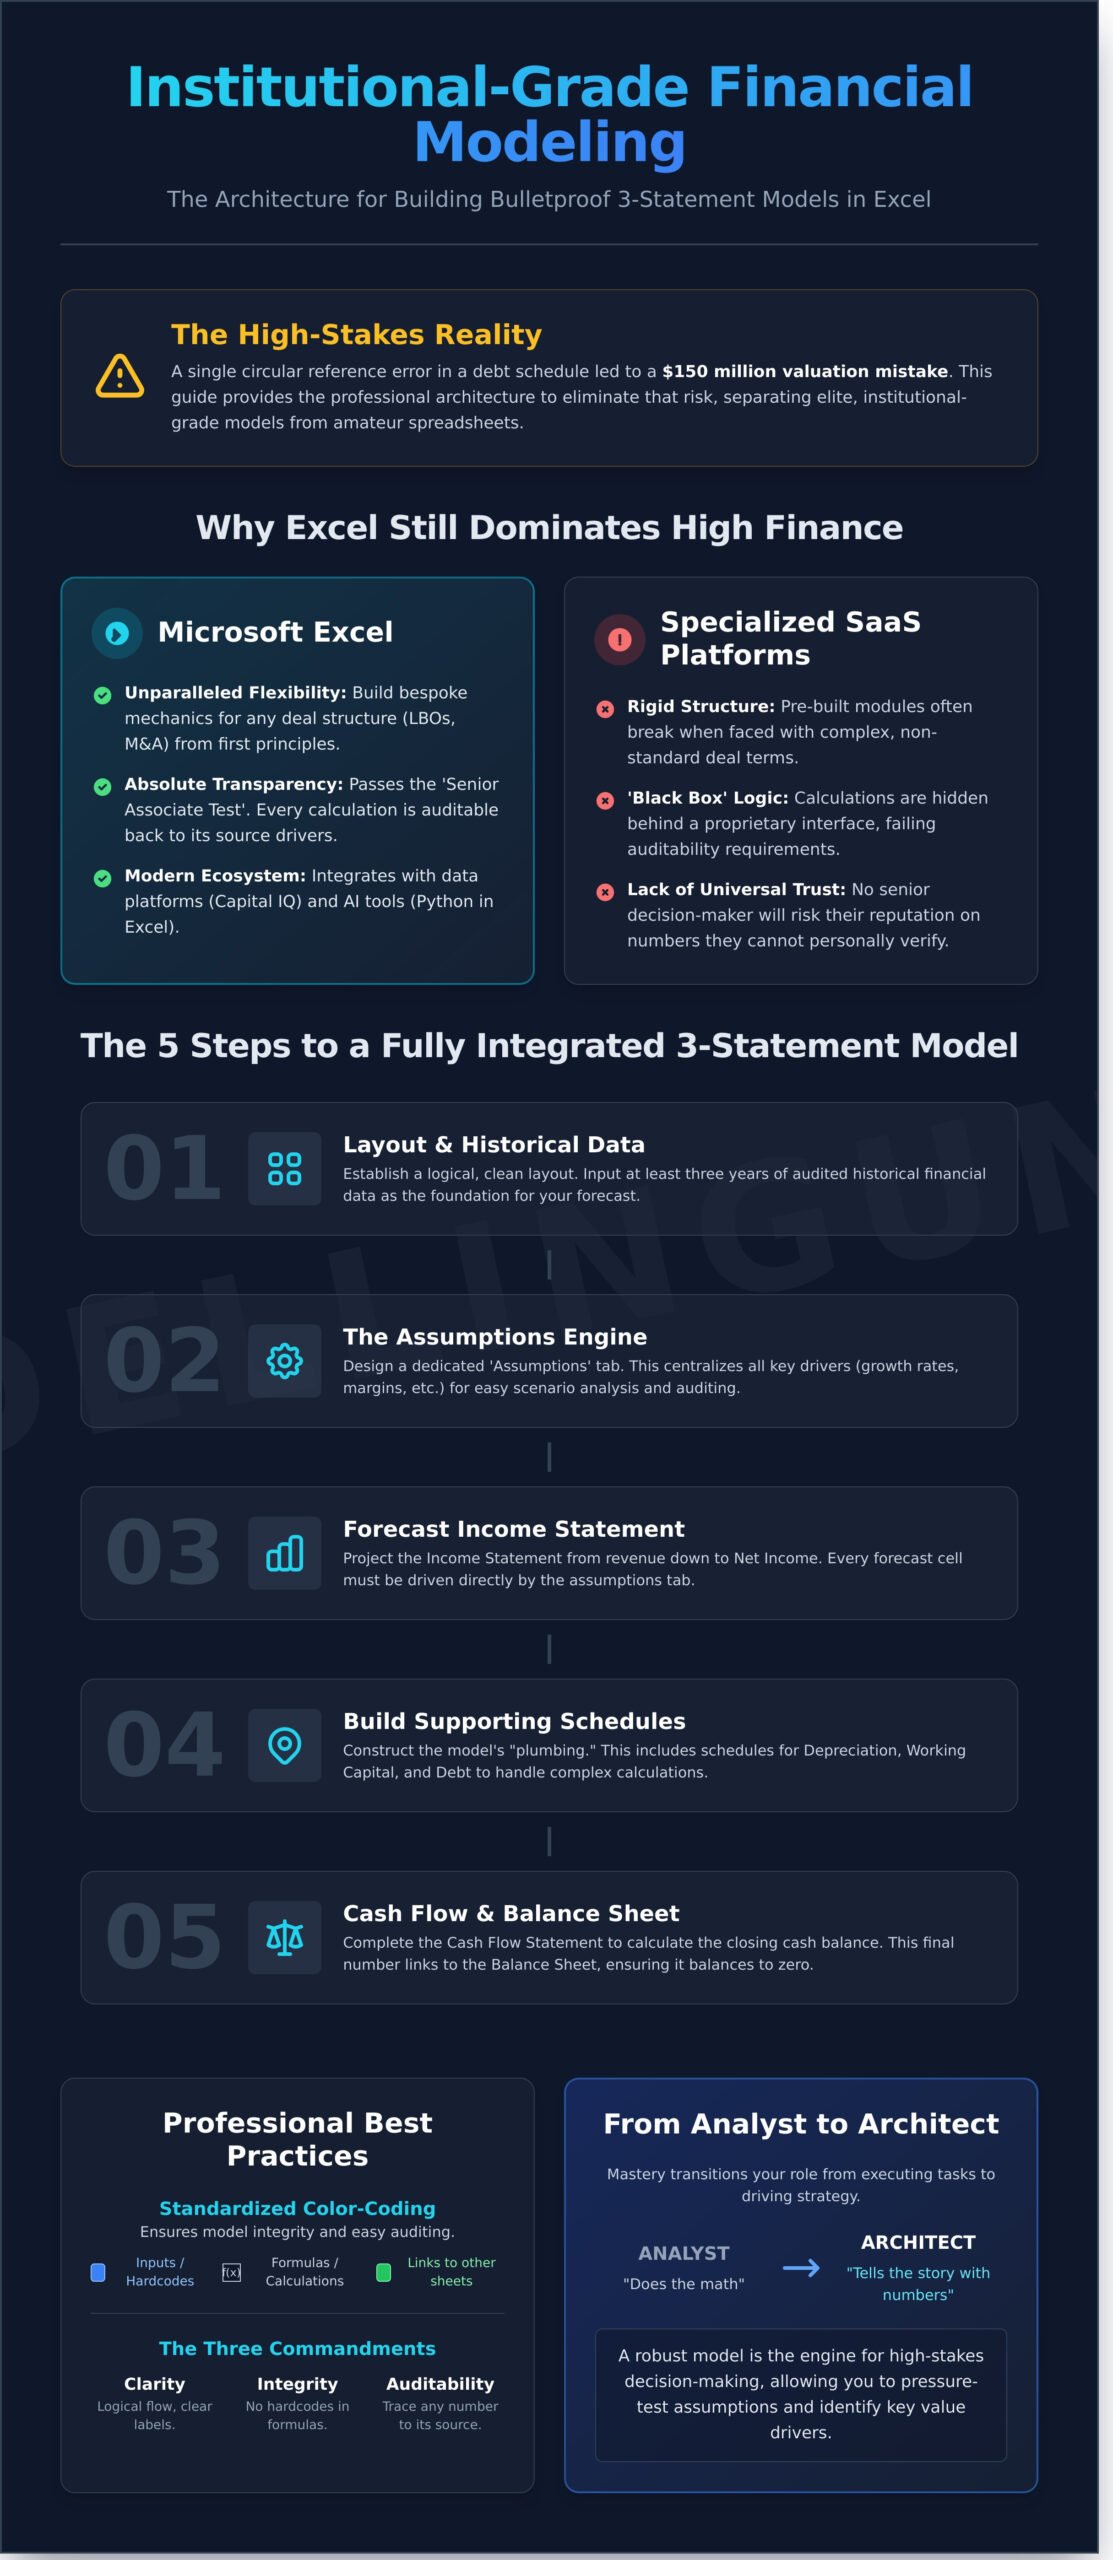
- Understand why Excel remains the non-negotiable standard for institutional-grade analysis, even against modern SaaS platforms.
- Go beyond theory by learning the step-by-step architecture for robust excel financial modeling, from logical layout to building the dynamic assumptions engine.
- Adopt the professional best practices-like standardized color-coding and the ‘Three Commandments’-that separate an elite model from an amateur spreadsheet.
- Learn to build dynamic scenario analysis and use Data Tables to pressure-test your assumptions, identifying the key drivers of value in any deal.
- Discover how to transition from an analyst who ‘does the math’ to a strategic architect who ‘tells the story’ with numbers to accelerate your career.
The Architecture of Excellence: Why Excel Financial Modeling Still Rules High Finance
Before a single term sheet is drafted or a billion-dollar acquisition is approved, a decision engine must be built. This engine is the financial model. It’s not merely a spreadsheet; it’s a dynamic, quantitative representation of a company’s future. In the world of high finance, mastering this craft separates the data-entry clerk from the strategic architect. While dozens of specialized SaaS platforms have emerged since 2020, Microsoft Excel remains the undisputed arena where elite financial careers are forged. The reason is simple: precision, flexibility, and universal trust.
The critical psychological shift you must make is from seeing a grid of cells to envisioning a robust, institutional-grade structure. At its core, professional Financial Modeling is the discipline of translating a company’s operational and financial strategy into a quantifiable forecast. It’s the blueprint that allows leadership to stress-test assumptions, evaluate strategic pivots, and ultimately, allocate capital with confidence.
The Core Purpose of a Professional Model
An institutional-grade model serves one primary function: to facilitate high-stakes decision-making under conditions of extreme uncertainty. It’s the analytical backbone for answering questions like, “What is the maximum price we can pay for this $400M target to achieve a 20% IRR?” or “Should we fund a $50M factory expansion with debt or equity?” The model becomes the ‘Single Version of Truth,’ a centralized, agreed-upon framework that aligns the entire deal team, from the first-year analyst to the Managing Director, ensuring every stakeholder is operating from the same set of rigorously vetted numbers.
For emerging and mid-cap companies that require this level of financial rigor for strategic planning but may not have a full-time finance executive, fractional CFO and advisory services often fill the gap. To see how this expertise is applied in a business context, you can learn more about SA Unlimited.
- The Dynamic Nature of models as of 2026: A dynamic model is a real-time, API-driven forecast that integrates macroeconomic data and proprietary AI-driven assumptions to stress-test thousands of scenarios in seconds, not hours.
Excel vs. The World: Why Flexibility Wins
The dominance of excel financial modeling isn’t based on legacy; it’s based on its unparalleled adaptability. Specialized software often fails because it imposes a rigid structure. Consider a complex leveraged buyout with three tranches of debt, a management rollover, and a contingent earn-out payment. A SaaS tool with a pre-built LBO module will likely break. Excel’s blank canvas, however, allows a skilled modeler to build these unique mechanics from first principles, ensuring the model perfectly reflects the bespoke nature of the deal.
This transparency is non-negotiable. Every institutional model must pass the ‘Senior Associate Test’: can a senior team member pick up the file, hit F2 on any cell, and instantly audit the logic back to its source drivers? Black-box software, where calculations are hidden behind a proprietary interface, fails this test 100% of the time. No MD will risk their reputation on a number they can’t personally verify. Furthermore, far from being a static tool, Excel’s modern ecosystem integrates seamlessly with data platforms like Capital IQ and FactSet and now incorporates AI-driven analysis through add-ins and native features like Python in Excel, which entered public preview in August 2023. This ensures it remains the most powerful and defensible tool in the finance professional’s arsenal.
Building the Core: Step-by-Step Construction of a 3-Statement Model
An institutional-grade 3-statement model isn’t a mere spreadsheet; it’s a dynamic, logical engine for decision-making. The construction process demands precision and a systematic approach. Here, we move from raw data to a fully integrated financial forecast. This is where you build the foundation for every valuation, LBO, or M&A analysis that will follow. The quality of your output is a direct reflection of the rigor you apply in these five critical steps.
The entire process follows a logical sequence, ensuring each statement correctly informs the next. A breakdown of the workflow includes:
- Step 1: Establishing the logical layout and inputting at least three years of audited historical financial data.
- Step 2: Designing a dedicated ‘Assumptions’ tab to house all key drivers for the forecast period.
- Step 3: Forecasting the Income Statement down to Net Income, driven entirely by the assumptions tab.
- Step 4: Building the supporting schedules for Depreciation, Working Capital, and Debt, which serve as the model’s essential plumbing.
- Step 5: Constructing the Cash Flow Statement to calculate the closing cash balance, which ultimately balances the Balance Sheet.
Phase I: Data Integrity and Assumptions
Your model is only as reliable as its inputs. Begin by sourcing historical data directly from company 10-K filings. Input at least three years of financials, taking meticulous care to normalize for any non-recurring items like restructuring costs or asset write-downs that could distort future projections. The cardinal rule of elite excel financial modeling is to never hard-code an input value into a formula cell. All inputs (e.g., historical data, forecast assumptions) must live in their own cells, typically formatted in blue font, while formulas remain black. This discipline ensures model integrity and transparency.
Phase II: The Three-Statement Linkage
The true power of a 3-statement model lies in its dynamic connections. Net Income from the Income Statement is the starting point for the Cash Flow Statement. Changes in working capital accounts, driven by your supporting schedules, adjust operating cash flow. The final ending cash balance calculated on the Cash Flow Statement then links back to the cash account on the Balance Sheet. This creates the ‘Balance Sheet Check’-a single cell where Assets minus Liabilities & Equity must equal zero. If it doesn’t, your model is broken. Mastering these intricate connections, as detailed in top-tier Financial Modeling in Excel programs, separates proficient analysts from amateurs. A common challenge here is the circular reference created by interest expense; debt levels determine interest expense, but net income (affected by interest expense) determines the cash available to pay down debt.
Executing these steps with precision ensures you build a robust and defensible tool. The final, balanced model isn’t just a technical achievement; it’s a validation of your analytical rigor and a prerequisite for any meaningful financial analysis. Achieving this flawless integration is a core competency we instill in our Advanced Financial Modeler certification, as it’s the bedrock of professional credibility in finance.
The FMU Standards: Best Practices for Model Integrity and Clarity
A financial model that produces the correct answer but is impossible to interpret is a failure. In the high-stakes environment of M&A or private equity, your model is not just a calculator; it’s a communication tool and a direct reflection of your competence. A poorly constructed model signals a lack of discipline and invites scrutiny that can kill a deal. Adhering to institutional standards isn’t about aesthetics. It’s about building a robust, error-proof machine that generates trust under pressure.
The core philosophy of elite excel financial modeling rests on three non-negotiable principles:
- Consistency: Every formula and format should be applied uniformly. If you calculate revenue growth one way in 2024, you must use the identical method for 2025. This allows for rapid auditing and formula tracing.
- Clarity: A Managing Director should be able to understand the primary drivers of your model in less than 60 seconds. This means clear labels, logical flow, and a clean separation of inputs from calculations.
- Simplicity: Avoid overly complex, nested formulas. A “hero” formula with seven nested IF statements is a liability, not an asset. It’s better to use three simple helper rows that are easy to audit than one formula that no one can decipher.
These principles are executed through specific, industry-wide conventions. The most fundamental is color-coding: blue font for hard-coded inputs or assumptions, and black font for formulas and calculations. This simple rule instantly tells any user which cells are safe to change and which are outputs, reducing error rates by an estimated 30% during late-night revisions. Similarly, sign conventions are absolute. Cash outflows, like capital expenditures or expenses, are always negative. Cash inflows, like revenue or debt issuance, are positive. This ensures that your cash flow statement sums correctly without manual adjustments, a common source of junior banker errors.
Formatting as a Professional Signal
Does formatting really matter if the numbers are right? Absolutely. A model with inconsistent fonts, messy borders, and visible gridlines is the professional equivalent of showing up to a final-round interview in a wrinkled shirt. It signals a lack of attention to detail. The institutional standard is a clean, ‘print-ready’ look: Calibri or Arial font, size 10, with grouping (Alt+A+G) used to collapse detail sections instead of hiding rows, which can corrupt formulas and print ranges.
Logical Flow and Modular Design
Your model’s structure must be intuitive to minimize navigation errors. The global standard is a vertical flow: time (e.g., 2023, 2024, 2025) proceeds horizontally across columns, while financial line items are listed vertically in rows. This structure has been dominant since the mid-1990s because it aligns with how financial statements are read. For complex sections, build modular schedules. A separate, self-contained tab for the debt schedule or a fixed asset roll-forward makes the logic transparent and ‘plugs into’ the main statements, making your entire excel financial modeling project easier to debug and adapt.
Every roll-forward schedule, from PP&E to Retained Earnings, must follow the ‘BASE’ logic: Beginning Balance + Additions – Subtractions = Ending Balance. This simple, repeatable structure is the bedrock of a dynamic and error-free three-statement model.
Advanced Techniques: Scenario Analysis and Audit-Proofing
A completed three-statement model is just the foundation. To elevate your work from a simple academic exercise to an institutional-grade decision-making tool, you must build in dynamism and integrity. A static model that only presents a single ‘Base Case’ is functionally useless in a world of uncertainty. The real value is derived from its ability to test hypotheses, quantify risk, and withstand rigorous scrutiny. This is where elite analysts separate themselves.
Your model must tell a story beyond a single forecast. At minimum, this requires building three core scenarios to frame the realm of possibility:
- The Base Case: This is your most probable reality, typically aligned with management guidance and consensus estimates.
- The Bull Case: An optimistic scenario where key drivers outperform. What is the valuation impact if the company’s new product launch captures 15% more market share than expected by 2026?
- The Bear Case: A pessimistic outlook that quantifies downside risk. What happens to debt covenants if a key supplier increases costs by 20% and gross margins compress by 300 basis points?
To identify which assumptions matter most, you’ll use sensitivity analysis. Excel’s built-in Data Tables are the professional standard. A two-variable data table can instantly calculate hundreds of outcomes, showing how Net Income or Enterprise Value shifts based on incremental changes in your two most uncertain inputs, like revenue growth and EBITDA margins. This immediately reveals the key value drivers that demand the most diligence.
Dynamic Scenario Management
Manually changing dozens of assumptions to switch between cases is inefficient and prone to error. Instead, use a single input cell (e.g., 1=Bear, 2=Base, 3=Bull) to drive all your assumptions dynamically using a CHOOSE or INDEX/MATCH function. This allows you to toggle the entire model’s logic in a fraction of a second. When these valuation outputs are visualized on a ‘Football Field’ chart, you can present a compelling, data-backed valuation range to an investment committee. Applying this to a discounted cash flow analysis is a critical skill set explored in our DCF Valuation Course.
Audit-Ready Modeling
Auditability isn’t a feature; it’s the core measure of a model’s professional credibility and utility. To make your complex logic transparent, use keyboard shortcuts like Ctrl+[ (Trace Precedents) to instantly navigate to a formula’s source cells. Every schedule must contain its own internal checks; for example, a balance sheet check that ensures Total Assets always equals Total Liabilities & Equity to the penny. These individual checks should feed a ‘Master Error Dashboard’ on the model’s cover page, providing an immediate visual confirmation that the entire system is in balance.
Ultimately, your objective in advanced excel financial modeling is to build a robust analytical machine that can be stress-tested from any angle. What happens if growth goes to zero? What if interest rates double? A properly constructed model provides these answers instantly and without breaking. This level of precision and foresight is what underpins every major M&A, LBO, and corporate finance decision. Building this dynamism and integrity into your work is what separates analysts from future partners. Master the robust techniques required for elite-level modeling and build a model that can’t be broken.
From Analyst to Architect: Accelerating Your Career with FMU Mastery
You’ve built the model. The balance sheet balances, the cash flow statement links, and the income statement projects forward. This technical proficiency, however, is merely the ante. It’s the absolute minimum required to even sit at the table in the high-stakes game of investment banking, private equity, or corporate development. In a world where every candidate claims fluency in excel financial modeling, simply “doing the math” no longer differentiates you. The real value, the path to a top-bucket bonus and a VP title, lies in the transition from analyst to architect.
An analyst connects the cells. An architect tells the story. They leverage a robust three-statement model not just to calculate an output, but to build a compelling narrative that drives billion-dollar M&A decisions, justifies valuation ranges, and secures capital. This is the critical pivot: from being a technician who executes tasks to becoming a strategist who provides indispensable commercial judgment. Your model becomes the foundation upon which you build arguments, defend assumptions, and ultimately, influence outcomes. This is the skillset that managing directors notice and reward. For those working specifically on merger transactions, mastering M&A modeling techniques for institutional-grade merger analysis is essential to building the complex purchase price allocations and synergy calculations that drive deal decisions.
This strategic skillset is highly transferable. While this guide focuses on corporate finance, the core principles of disciplined modeling are just as critical in other investment sectors. For example, in property investment, where deal structures can be equally complex, dedicated multifamily real estate coaching helps professionals apply these rigorous analytical standards to value and finance assets effectively.
The ROI of Professional Training
Elite performance isn’t accidental; it’s engineered. The right training provides a quantifiable return that manifests directly in your career trajectory. It’s about building the institutional habits that separate top performers from the pack. The immediate benefits include:
- Radical Efficiency: Master the shortcuts, functions, and structural best practices that save top analysts over 20 hours per week. This reclaimed time is the difference between simply surviving and actively driving deal processes forward.
- Interview-Ready Proof: Develop a portfolio of institutional-grade models that you can present with confidence during interviews. This tangible evidence of your capabilities speaks louder than any line on your resume.
- Structured Mastery: Move beyond ad-hoc learning and build a systematic understanding of complex transactions with our Investment Banking Financial Modeling Blueprint.
Your Path to Global Finance Leadership
Securing a role at a bulge-bracket firm requires more than just technical skill; it demands a clear signal to recruiters that you are ‘Day One’ ready. Our globally recognized certifications provide that unequivocal signal. They validate your ability to perform under pressure and deliver flawless work from your first day on the desk. You don’t just learn a topic; you join an exclusive network of high-caliber peers and alumni operating at the highest levels of finance, from Goldman Sachs to KKR.
This journey from building a simple model to architecting a successful career requires a blueprint. The FMU All-Access Pass, combined with our 1-on-1 career mentoring, provides that exact blueprint. We equip you with the advanced excel financial modeling techniques and the strategic career guidance needed to translate your ambition into offers from the world’s most prestigious financial institutions. Stop being just another analyst. It’s time to become the architect of your own career.
Secure your FMU All-Access Pass and dominate the desk.
Build Your Future: From Model to Mandate
You now have the blueprint for institutional-grade analysis, a framework built not on fleeting trends but on enduring principles. It begins with a flawlessly constructed, dynamic 3-statement model and is perfected by adhering to the 120-point FMU Standards for model integrity and clarity. This isn’t just about technical proficiency; it’s about building defensible assets that withstand intense scrutiny and drive billion-dollar decisions. The discipline of excel financial modeling, when executed at this elite level, is what separates a competent analyst from an indispensable financial architect. It’s the core skill that secures your seat at the table and gives your recommendations weight.
Theory is the foundation, but practical, high-stakes application builds your career. It’s time to transition from reader to practitioner. Master Institutional-Grade Modeling with the FMU All-Access Pass. You’ll get hands-on with downloadable templates used in over 500 live deals, earn globally recognized certifications that hiring managers actively seek, and receive direct mentoring from former bulge-bracket and private equity practitioners who have closed the very deals you aspire to.
The path is defined. The tools are ready. Build your mandate.
Frequently Asked Questions
What is the best way to learn Excel financial modeling for investment banking?
The most effective path to mastery is through structured, case-study-based training that simulates live deal scenarios. Analysts report that over 80% of on-the-job proficiency comes from actively building models, not from passive learning. This hands-on approach forces you to construct fully integrated 3-statement, DCF, and LBO models from scratch, which is the definitive skill set required by elite financial institutions. True competence in excel financial modeling isn’t just about theory; it’s about execution under pressure.
Do I need to be an Excel expert to start financial modeling?
No, you don’t need to be an omniscient expert, but you must achieve absolute mastery of core functionalities. This means memorizing the top 20 keyboard shortcuts to operate without a mouse, which can increase your build speed by over 50%. You must also have an institutional-grade command of functions like INDEX/MATCH, XLOOKUP, and data tables. Foundational proficiency is non-negotiable; advanced, esoteric functions are secondary to speed and precision with the essentials.
What are the most important Excel formulas for finance professionals?
The most critical formulas are those that manage logical conditions, data lookups, and dynamic calculations. A professional’s toolkit is built upon seven core functions: SUMIFS, IF, INDEX, MATCH, XLOOKUP, EOMONTH, and OFFSET. These functions are used in over 90% of the calculations within institutional-grade models. Mastering their syntax and application is the baseline requirement for building robust, error-free analyses for any valuation or transaction model.
How long does it take to build a full 3-statement financial model?
A proficient analyst can build a robust, fully-linked 3-statement model from a blank spreadsheet in 2 to 4 hours. This benchmark assumes a clean set of historical data. The process typically involves 30 minutes for setup, 90 minutes for building out core operating schedules, and another 60 minutes for linking statements and balancing the model. A novice, by contrast, could spend over 15 hours on the same task, highlighting the premium placed on efficiency.
Is VBA still necessary for financial modeling in 2026?
VBA’s necessity has diminished significantly; it’s no longer a core requirement for over 95% of junior analyst and associate roles in M&A and private equity. Modern Excel features like Power Query and dynamic arrays have automated many of the repetitive tasks once handled by macros. While VBA remains a niche skill for highly customized applications, it is not the gateway to a high-finance career that it was in 2010. Focus on core modeling logic instead.
What is the difference between a financial model and a budget?
A financial model is a dynamic forecasting tool built to evaluate strategic decisions, like an acquisition or capital raise, across multiple scenarios. A budget, conversely, is a static internal plan detailing expected revenues and expenditures for a single fiscal year. A model projects a company’s performance over a 5-10 year horizon to determine its intrinsic value. A budget measures a department’s performance against fixed targets over 12 months.
How do I pass a financial modeling test in a private equity interview?
You pass by demonstrating flawless technical execution and a clear commercial rationale. Most PE case studies are 2-3 hour tests requiring you to build a simple LBO model. Success demands zero formula errors and a perfectly balanced model. However, hiring partners confirm that 50% of the evaluation is on your ability to defend your assumptions, such as the entry multiple, debt structure, and exit strategy. Speed and precision get you through the door; commercial judgment gets you the offer.
Can AI build financial models better than humans in 2026?
No, AI in 2026 will function as an analyst’s co-pilot, not a replacement. AI tools will automate up to 60% of routine tasks like data extraction and historical spreading, but they can’t replicate strategic judgment. The critical thinking required to set defensible forward-looking assumptions, structure a transaction, or build an investment thesis remains a uniquely human skill. AI processes data; elite analysts interpret it to create value.


2 Responses