

Most budget overruns in FP&A don’t come from bad revenue forecasts. They come from headcount.
A hire that starts two months late, a backfill nobody budgeted for, a department head who submitted requests at base salary while forgetting benefits and payroll taxes – and suddenly you’re explaining to the CFO why actual labor costs are 18% above plan.
This guide walks through the full headcount planning process, including exactly how to structure your Excel template so the numbers that come out of it are actually usable.
What Headcount Planning Actually Involves (for FP&A)
Headcount planning is the process of forecasting how many people your company needs, when they need to start, and what they will cost – within a defined budget and time horizon.
For FP&A, this typically covers a 12-month rolling window and produces a number that feeds directly into your operating expense forecast and three-statement financial model.
It is worth separating this from workforce planning, which is a longer-range exercise (2–5 years) focused on organizational capability and talent pipeline. Headcount planning is tactical and cost-driven. It answers: how many people, which roles, which departments, starting when, and at what fully-loaded cost.

Step 1: Gather Your Inputs Before Building Anything
The quality of a headcount plan is entirely determined by the quality of the inputs.
Before opening Excel, pull together:
- Current employee roster from your HRIS or payroll system, including department, role, employment type (FTE, contractor, part-time), start date, and base salary
- Approved open roles and any pending headcount requests from department heads
- Revenue or volume targets from the operating plan – these anchor your top-down ratios
- Historical attrition rate by department, not a company-wide average, because a 40% attrition rate in a call center and a 5% rate in engineering require very different planning assumptions
- Average time-to-fill by role level – a senior engineer might take 90 days to hire while an entry-level analyst takes 30; ignoring this shifts your cost timing materially
One point that creates persistent problems: Finance and HR often use different headcount definitions. HR may count contractors and part-time workers in total headcount figures, while Finance typically works in full-time equivalents (FTEs).
Agree on the definition before you build anything, or you will spend your quarterly reviews reconciling numbers instead of analyzing them.
Step 2: Calculate Your Fully-Loaded Cost per Employee

This is where most headcount plans go wrong. Department heads submit salary figures. Finance adds them up. The budget is set. Then actuals come in 25% higher because nobody modeled benefits, payroll taxes, equipment, or onboarding costs.
The correct formula is:
Fully-Loaded Cost = Base Salary × (1 + Payroll Tax % + Benefits %) + Annual Bonus + Per-Hire Overhead
Here is what that looks like with real numbers for a mid-level hire:
| Cost Component | Amount |
| Base salary | $80,000 |
| Payroll taxes (~9%) | $7,200 |
| Benefits (~18%) | $14,400 |
| Annual bonus (10%) | $8,000 |
| Equipment + onboarding overhead | $4,000 |
| Fully-loaded annual cost | $113,600 |
That $80,000 salary costs the company $113,600 – a 42% premium. For SaaS companies specifically, salary costs alone account for roughly 55% of total operating expenses on the median, according to Lighter Capital’s 2025 B2B SaaS Benchmarks. When you include all the overhead components above, the true labor cost burden is considerably higher.
Build these multipliers into your assumptions tab and link every hire to them automatically. Hard-coding salary figures without applying the burden rate is the single most common reason headcount budgets are understated.
This fully-loaded cost figure is also what flows into your financial model’s operating expense schedule – using base salary alone will understate your cost structure and distort EBITDA projections.
Step 3: Choose Your Planning Approach
FP&A teams use three approaches, and the right one depends on your planning stage:
Top-down: Finance sets the overall headcount budget using revenue targets and efficiency ratios – for example, revenue per employee, or a target ratio of support staff to direct producers. This is fast and good for the first pass of annual budgeting. The risk is that it can miss legitimate operational needs at the department level.
Bottom-up: Department heads submit detailed staffing requests role by role, with justifications tied to their operating goals. This produces a more granular and accurate plan. The risk is that requests tend to be inflated, and without financial guardrails, bottom-up plans routinely exceed the top-down budget by 20–30%.
Hybrid (recommended): Finance runs the top-down model first to establish the budget envelope. Department heads then fill that envelope bottom-up. The gap between the two is the negotiation – and framing it that way makes the conversation faster and less adversarial. Most mature FP&A teams operate this way.
Step 4: Build Your Headcount Planning Template in Excel
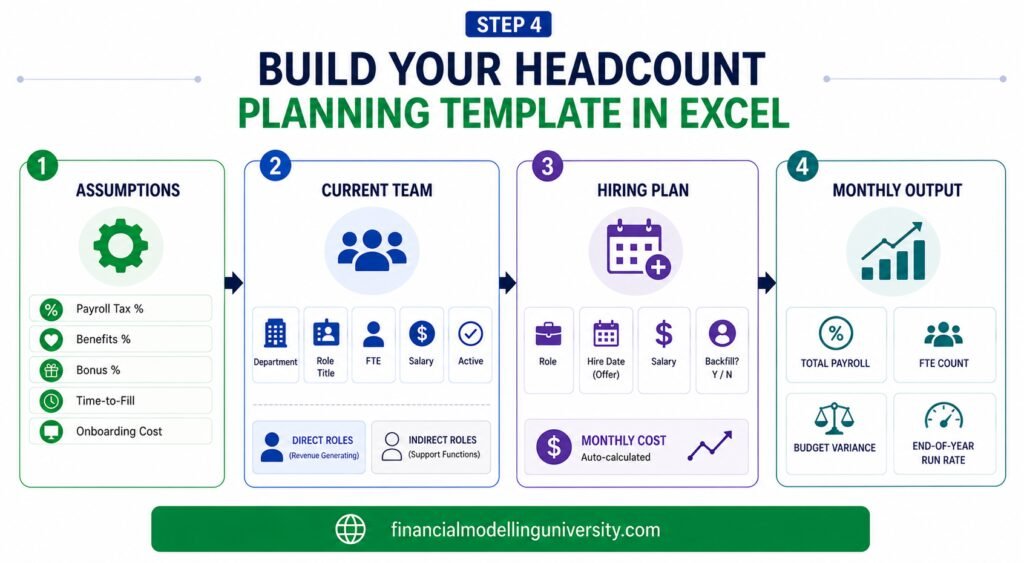
The Excel template is where the process becomes concrete. A functional headcount planning template needs four tabs:
Tab 1: Assumptions
Set all rate inputs here and link everything else to this tab. Never hard-code rates into your plan rows. Include:
- Fiscal year start
- Payroll tax % (varies by country/state – use your actual rate or a conservative estimate)
- Benefits % (typically 15–25% of base salary depending on your plan)
- Bonus % by level or department
- Average time-to-fill by role category (junior, mid, senior, leadership)
- Equipment and onboarding overhead per hire
Tab 2: Current Employee Roster
One row per employee. Columns should include:
| Column | Notes |
| Department | Use a standardized list, not free text |
| Role / Title | |
| Employee type | FTE / Contractor / Part-time |
| Start date | |
| Base salary | Annual |
| Active (Y/N) | Toggle for scenario modeling |
Group employees into direct (roles tied to production, sales, or revenue delivery) and indirect (G&A, finance, HR, IT support). This split is critical for consistency checks later and for companies with significant variable cost structures.

Tab 3: Headcount Plan (Future Hires)
Same structure as Tab 2, plus:
- Planned hire date (the date the offer is accepted, not the start date – offset by your time-to-fill assumption to get the actual cost start date)
- Monthly cost (formula-driven: = (Annual Salary / 12) × (1 + Tax% + Benefits%) + (Bonus / 12))
- Backfill Y/N (distinguishes replacement hires from net new headcount)
Tab 4: Monthly Summary Output
This is what you present to leadership. It should auto-calculate:
- Total monthly payroll cost by department
- Cumulative FTE count (current + net new hires, adjusted for attrition)
- Budget vs. plan variance column
- End-of-year run rate
Keep this tab formula-driven with no manual inputs. If someone updates a hire date in Tab 3, the monthly cost timing in Tab 4 should update automatically.
For a practical starting point, download our Excel financial modeling templates and adapt the structure to your organization. (Ovde bi bilo zgodno ako ima template ili da mi napravimo pa da bude downloadable)
Step 5: Run the Consistency Check
This is the step that separates a well-built headcount plan from one that will embarrass you in a board meeting. After assembling the plan, validate it against your operational drivers before you submit it.
Four checks to run:
Revenue per employee ratio. Divide your projected revenue by projected year-end FTE count. Compare this to the prior year and to industry benchmarks. If headcount is growing 20% while revenue is growing 8%, you need a clear explanation for why productivity is declining, or you need to reduce the plan. The cross-industry average revenue per employee in 2024 was approximately $350,000, though this varies significantly by sector, according to HRBench.
Direct headcount vs. volume ratio. If your production volume (units, customers, transactions) is growing 20% but your direct headcount is only growing 5%, flag it. Either you are assuming a significant productivity improvement – which should be documented – or the plan is understaffed and delivery will suffer.
Attrition buffer. Take your historical attrition rate by department and check whether the plan accounts for it. If engineering has 12% annual attrition and you have 50 engineers, you need roughly 6 backfills in your plan just to hold headcount flat. Many plans ignore this and end up understating replacement hiring costs.
Department ratio benchmarks. Common reference points: 1 HR generalist per 100 FTEs, 1 manager per 7–8 individual contributors in most functions. These are not rigid rules, but a plan that shows 1 manager for every 20 ICs or 1 for every 3 warrants a conversation before it goes to the CFO.
Key Metrics to Track Once the Plan Is Live

Once the headcount plan is approved and hiring begins, track these five metrics monthly:
- Actual vs. plan headcount by department – the most basic signal of whether execution is on track
- Time-to-hire by role level – delays shift your cost timeline and can create a false sense of budget surplus mid-year that evaporates in Q4
- Attrition rate – if a department is running higher than assumed, your net headcount and cost projections are both wrong
- Revenue per employee – tracks whether headcount growth is translating into proportional productivity
- Fully-loaded cost vs. budget – the number the CFO watches; make sure you are comparing against fully-loaded actuals, not just salary payroll runs
Common Mistakes in Headcount Planning
These are the issues that show up repeatedly in budget reviews:
- Planning at base salary only. The fully-loaded cost is 30–45% higher. Models built on salary lines alone routinely understate labor costs.
- Ignoring hire date timing. A Q1 hire and a Q3 hire for the same role have very different annual cost impacts. A hire that slips by one quarter saves roughly 25% of annual cost in-year – but that saving disappears next year and creates a false impression of budget discipline.
- Single-scenario planning. If your one scenario is the approved plan and it misses, there is nothing to fall back on. Build a conservative and an aggressive scenario from the start.
- Treating the plan as a one-time annual exercise. A headcount plan built in October is often materially wrong by March. Reforecast quarterly at a minimum.
- Misaligned headcount definitions between Finance and HR. If Finance is tracking FTEs and HR is counting all workers including contractors, every reporting conversation starts with a reconciliation instead of an analysis.
Frequently Asked Questions
Conclusion
Headcount planning is not complicated in principle, but it breaks down repeatedly in practice because teams skip the inputs phase, underestimate fully-loaded costs, or build a plan they never revisit.
The Excel template structure above gives you a framework that is actually connected – assumptions drive costs, costs drive the monthly output, and the consistency checks give you a way to defend the numbers before someone else punches holes in them. Build it once, maintain it quarterly, and make sure the cost figures flowing into it are fully-loaded from day one.