


A working capital schedule can look precise and still send cash flow in the wrong direction. If you’re unsure which balance sheet accounts to include, or why a rise in receivables doesn’t reconcile to cash, the issue is usually the schedule’s structure or sign convention. A robust working capital schedule financial model separates operating balances from financing items, then links each balance to a relevant business driver.
This article shows you how to forecast trade receivables, inventory and trade payables using days-based assumptions: days sales outstanding (DSO), days inventory outstanding (DIO) and days payable outstanding (DPO). You’ll learn how to choose a sensible basis for each assumption, calculate forecast balances from revenue or cost of goods sold, and flow period-on-period movements into the cash flow statement. Finally, you’ll check the three-statement model for formula, sign and reconciliation errors, so the schedule is transparent, driver-based and ready to support sound analysis.
A balance sheet lists current accounts, but a working capital schedule should forecast only the operating balances needed to explain cash timing. In a three-statement model, it projects those balances period by period and shows how their movements affect cash flow. For example, when a business makes a sale on credit, it may recognise revenue before the customer pays. Receivables rise, and cash is tied up until collection.
Working capital broadly refers to current assets less current liabilities. A financial model often narrows this to operating working capital, excluding items such as cash and borrowings because they are usually forecast elsewhere. Define the scope before building the schedule, then apply it consistently to historical periods, forecasts and statement links.
Trade receivables, inventory and trade payables are common operating balances. Depending on the business and model scope, include other operating items such as prepayments, accrued expenses or deferred revenue if they materially affect cash timing. Check the chart of accounts and map each included account to its balance sheet line. Document exclusions too, so an item isn’t accidentally counted both in the schedule and elsewhere in the model.
The cash conversion cycle is an analytical measure of the time taken to convert operating investment into cash. It is commonly expressed as days sales outstanding (DSO) plus days inventory outstanding (DIO), less days payable outstanding (DPO). These days-based measures are useful drivers, but they aren’t the schedule itself. A schedule forecasts account balances and their changes over time.
Keep the concepts distinct: the schedule forecasts operating balances, net working capital is a balance measure, and the cash conversion cycle measures operating timing. A working capital schedule financial model uses drivers such as DSO, DIO and DPO to estimate balances, then sends changes in those balances to cash flow. A cycle metric alone can’t provide the balance sheet forecast or its cash flow movement.
Days-based assumptions turn operating activity into forecast balances. DSO estimates how long it takes to collect customer invoices; DIO estimates how long stock is held; DPO estimates how long the business takes to pay suppliers. Use the same day-count convention in the driver calculation and forecast period, such as 365 days annually or the actual days in a month. If you use a quarterly convention, keep it consistent across the calculation and periods being compared.
| Balance | Driver and calculation | Denominator | Unit |
|---|---|---|---|
| Trade receivables | DSO × revenue ÷ days in period | Credit revenue, if available; otherwise revenue as a proxy | Currency |
| Inventory | DIO × cost of goods sold ÷ days in period | Cost of goods sold (COGS) | Currency |
| Trade payables | DPO × relevant purchases or COGS ÷ days in period | Supplier purchases where available; COGS may be a proxy | Currency |
Match each balance to the activity that creates it. For receivables, use credit sales where the data supports it. Total revenue can overstate the receivables base if cash sales are material. Inventory is generally linked to COGS. Payables are better linked to supplier purchases when those are available, since COGS may include costs that don’t pass through trade payables. Accounting policies and data availability can require a different basis, so document the choice and apply it consistently.
Historical days provide evidence, not an automatic forecast. Check for seasonality, rapid growth, changed customer or supplier terms, and unusual periods that distort closing balances. Compare the ratio across periods and investigate sharp changes before using an average. If business segments have different collection patterns, stock cycles or supplier arrangements, model them separately where practical rather than letting an aggregate average conceal the differences.
Choose a driver that reflects the operating activity behind the balance, not simply the historical ratio that is easiest to calculate. That discipline makes a working capital schedule financial model more transparent and easier to challenge.
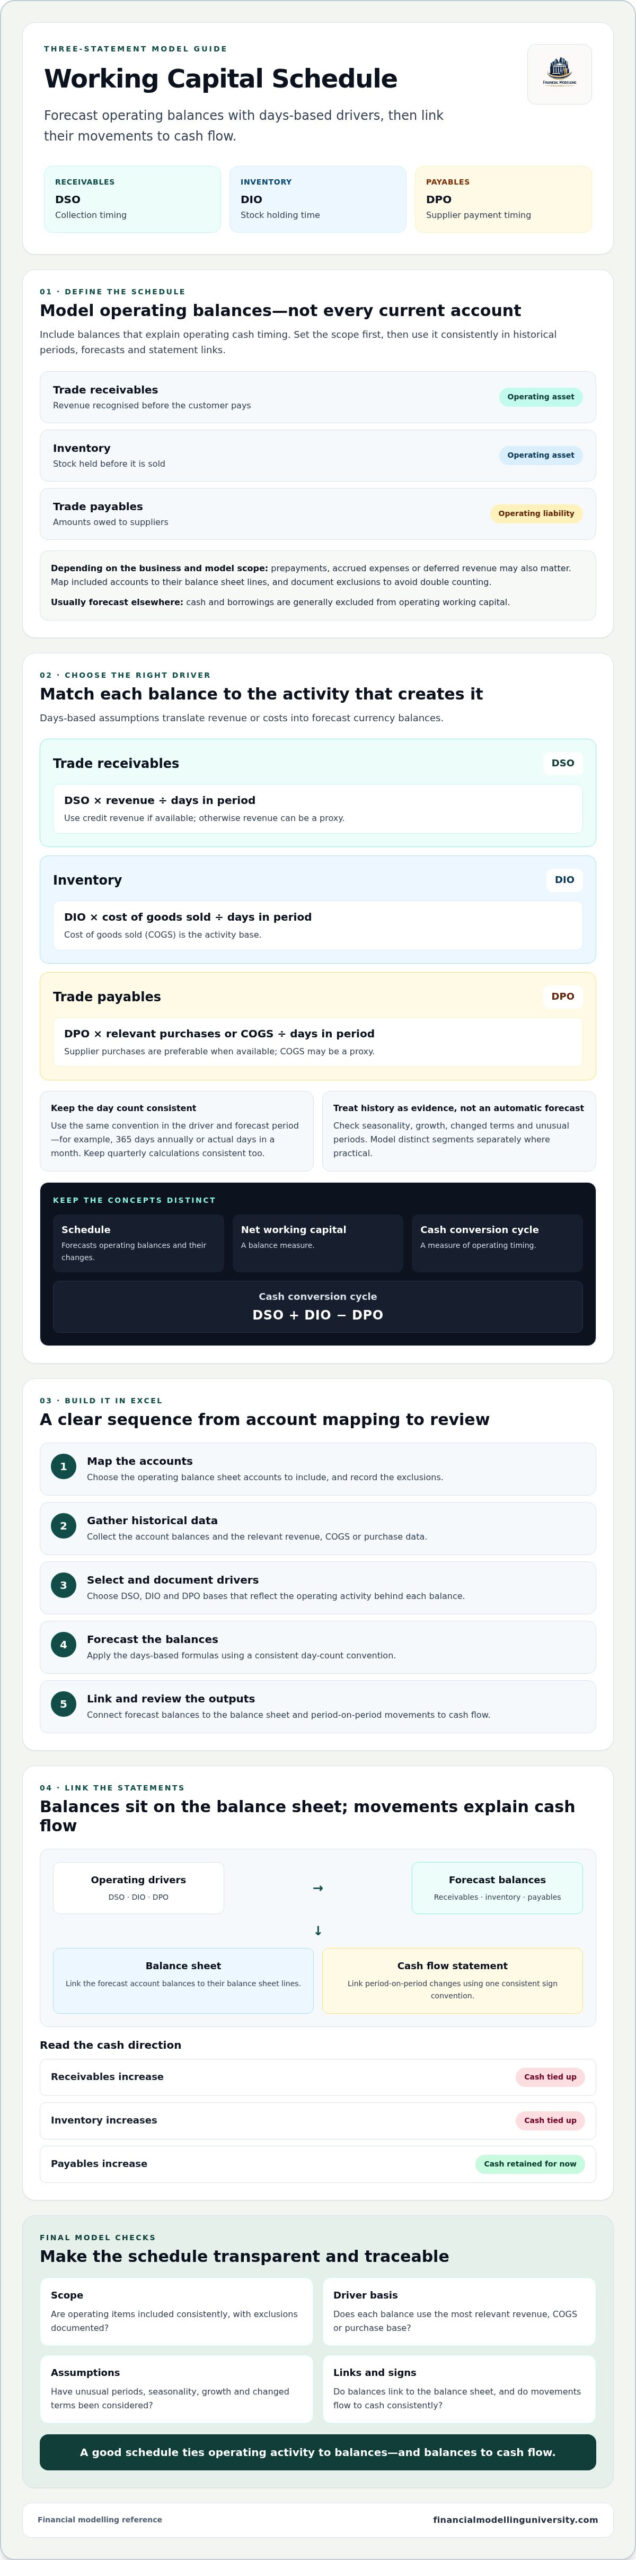
Build the schedule in a clear sequence. Keep historical actuals, forecast assumptions and calculated outputs visibly separate, and use matching periods throughout. In Excel, label the units and day-count convention near the assumptions, and keep the formula for each forecast balance traceable to its driver and activity base. A working capital schedule financial model is easier to audit when each output has a clear source.
Hypothetical quarterly example, all figures in £000: assume a 90-day quarter, revenue of £900, COGS of £540, DSO of 24 days, DIO of 36 days and DPO of 30 days. Prior-quarter receivables were £210, inventory £190 and payables £125. For simplicity, use COGS as the payables base.
Define the cash flow impact as the negative change in operating net working capital: −[(£240 − £210) + (£216 − £190) − (£180 − £125)] = −£1. The £1 increase in net working capital is a cash outflow. Higher receivables and inventory tie up £56, partly offset by £55 of additional payables.
Check each calculation manually against the inputs before relying on Excel outputs. This simplified example assumes activity is evenly distributed across the quarter. Seasonality, credit sales that differ from total revenue, or purchases that differ from COGS may require different drivers or period assumptions.
Link each forecast closing operating balance to its matching balance sheet line, then send the period-on-period movement to the cash flow statement. The income statement provides the revenue and cost drivers used to forecast balances, while the schedule translates those operating assumptions into balance sheet and cash flow effects. Keep account classifications and formulas consistent across all three statements. For each account, distinguish the closing balance used on the balance sheet from the change used in the cash flow calculation.
Under the indirect cash flow method, an increase in operating net working capital generally uses cash, while a decrease generally releases it. If you define operating net working capital as receivables plus inventory less payables, the cash flow adjustment is the negative of its change. Other operating accounts may be included depending on the model’s scope, so use the same definition throughout.
Hypothetical example: assume receivables rise from £100 to £110 and all other operating balances are unchanged. The balance sheet records closing receivables of £110. The cash flow statement records a £10 outflow, calculated as −(£110 − £100), because the additional receivable represents revenue not yet collected.
Audit the schedule account by account. A correct forecast should satisfy opening balance + movement = closing balance. Then check that:
If the balance sheet does not balance, inspect the working capital links and sign conventions before adjusting unrelated lines. A reliable working capital schedule financial model should reconcile each account and make its cash impact traceable.
A reliable working capital schedule financial model does more than project receivables, inventory and payables. It uses drivers that reflect the business, carries forecast balances onto the balance sheet, and translates each movement into a consistent cash flow adjustment.
Keep the schedule auditable: document which accounts are included, check each opening balance plus movement against its closing balance, and investigate cash movements that don’t fit the operating assumptions. These checks help catch sign, formula and linkage errors before they affect your wider three-statement model.
To practise financial modelling, explore FMU’s financial modelling courses. The course library includes LBO Financial Models and DCF & Valuation, with downloadable Excel models or templates and practical exercises as course materials. Use these resources to practise building and checking financial models.
A working capital schedule forecasts selected operating current assets and liabilities, such as trade receivables, inventory and trade payables. It shows how these balances are expected to change over time and supports the balance sheet and cash flow forecast. It isn’t necessarily a forecast of every current account: define which operating items are included and apply that scope consistently across the model.
Map the operating accounts, link historical balances and activity, then set forecast drivers and calculate closing balances by period. For example, receivables can be forecast as DSO multiplied by revenue, divided by days in the period. Use the relevant cost base for inventory and payables. Keep assumptions distinct from formulas, and check that each period’s opening balance plus movement equals its closing balance.
Days sales outstanding (DSO), days inventory outstanding (DIO) and days payable outstanding (DPO) translate operating activity into balance estimates. Higher DSO generally increases receivables; higher DIO generally increases inventory. Higher DPO generally increases payables, reducing operating net working capital, all else equal. The working capital schedule financial model should use drivers that fit actual collection, stock and supplier patterns, not ratios carried forward without review.
Forecast closing operating balances appear on the balance sheet, while their period-on-period changes adjust cash flow. Under the indirect method, an increase in operating net working capital generally reduces cash, and a decrease generally releases cash. For example, if inventory rises while other operating balances are unchanged, the increase is a cash outflow. Keep account classifications and signs consistent across statements.
Check each balance roll-forward, confirm opening balance plus movement equals closing balance, and trace forecast formulas to their assumptions and source data. Verify periods, units and day-count conventions. Test whether increases and decreases produce the intended cash flow signs. Investigate unexpected movements against operating drivers and historical patterns, and confirm that schedule balances link to the correct balance sheet lines and cash flow adjustments.
Explore FMU’s LBO Financial Models course to practise building financial models with downloadable Excel materials and practical exercises.