

A higher purchase price does not automatically make an acquisition dilutive. The key test is whether pro forma earnings per share (EPS) is above or below the buyer’s standalone EPS. An M&A accretion and dilution model combines the buyer’s and target’s earnings with transaction effects, then compares pro forma EPS with the buyer’s baseline. The deal is accretive if pro forma EPS is higher and dilutive if it is lower.
Building the model in Excel makes the drivers visible. You can test how purchase price, cash or debt financing, shares issued, interest expense and synergies affect the result, rather than relying on a headline multiple or rule of thumb. The calculation depends on clear assumptions: ignoring financing costs or deal adjustments can produce a misleading answer.
This worked example shows how to organise inputs, calculate pro forma net income and shares, and measure EPS accretion or dilution with auditable formulas. Follow the steps to build a practical Excel framework, interpret the result and recognise when a more detailed transaction model is needed.
An M&A accretion and dilution model tests how an acquisition may change the buyer’s projected earnings per share (EPS). It combines the target’s earnings with transaction effects, then compares pro forma EPS with the buyer’s standalone result.
List operational synergies, such as combining overlapping functions, separately from financing benefits. Cost savings may reduce selling, general and administrative (SG&A) expenses, increasing net income and EPS. Financial synergies may arise from the transaction’s funding structure. Link each benefit to a specific earnings line and its source, and avoid counting the same saving in multiple assumptions.
Enter the target’s standalone earnings before adding deal benefits. Then model each synergy separately, including its expected timing and income-statement effect. This distinguishes earnings the target already generates from earnings that depend on integration. Accretion means pro forma EPS is above the buyer’s standalone EPS; dilution means it is below. A deal may be more palatable if accretion is reasonably likely from year two onward.
Show integration costs separately from recurring synergies and reflect them in the relevant forecast periods. Systems consolidation or restructuring may require spending before operational savings emerge. Account for the timing and impact carefully: showing future cost reductions without related transaction effects can overstate earnings. EPS also has limits. It does not measure cash generation, strategic value or whether the purchase price creates value for shareholders.
Check assumptions for earnings, financing, synergies, tax treatment and shares issued. Common errors include double-counting target earnings, omitting deal costs or treating projected savings as certain. Separate cash results from purchase-accounting adjustments, such as asset write-ups and write-downs. EPS accretion is a comparison, not proof of deal quality; different tax rates or unmodelled integration effects can make a shortcut misleading.
Build a forecast using aligned financial statements and transaction assumptions. Gather the buyer’s and target’s income statements, balance sheets, share data, financing terms and earnings forecasts for matching periods.
Use the statements to identify each company’s earnings, cash, debt and share base. Add assumptions for purchase consideration, funding mix, interest rates, tax treatment and projected performance. Record whether each input is historical or forecast, and align the periods. Different reporting periods can distort the combined comparison, while inconsistent financing assumptions can misstate pro forma leverage and interest effects.
Start with projected buyer and target net income, then add or subtract transaction effects. Link debt funding to interest expense and cash funding to foregone interest income. Put each adjustment on a separate line with a clear formula. This makes it easier to trace how the deal changes earnings and update an assumption without concealing its effect in a combined forecast.
Calculate any shares issued as consideration and add them to the buyer’s weighted average shares outstanding. In the illustrative example, 15 existing shares plus 2.8 newly issued shares equal 17.8 pro forma shares. Cash consideration doesn’t add shares. Reconcile issued equity to the transaction terms, and don’t include target shares that won’t remain outstanding after closing.
Divide pro forma net income by pro forma shares outstanding, then compare the result with standalone EPS. The example reports net income of 23.2 and 17.8 shares: those displayed figures calculate to about 1.30 per share. The reported 1.31 EPS and 8.8% accretion may reflect unrounded model inputs; calculate the percentage using unrounded EPS, not rounded displays. A deal is accretive when pro forma EPS exceeds standalone EPS.
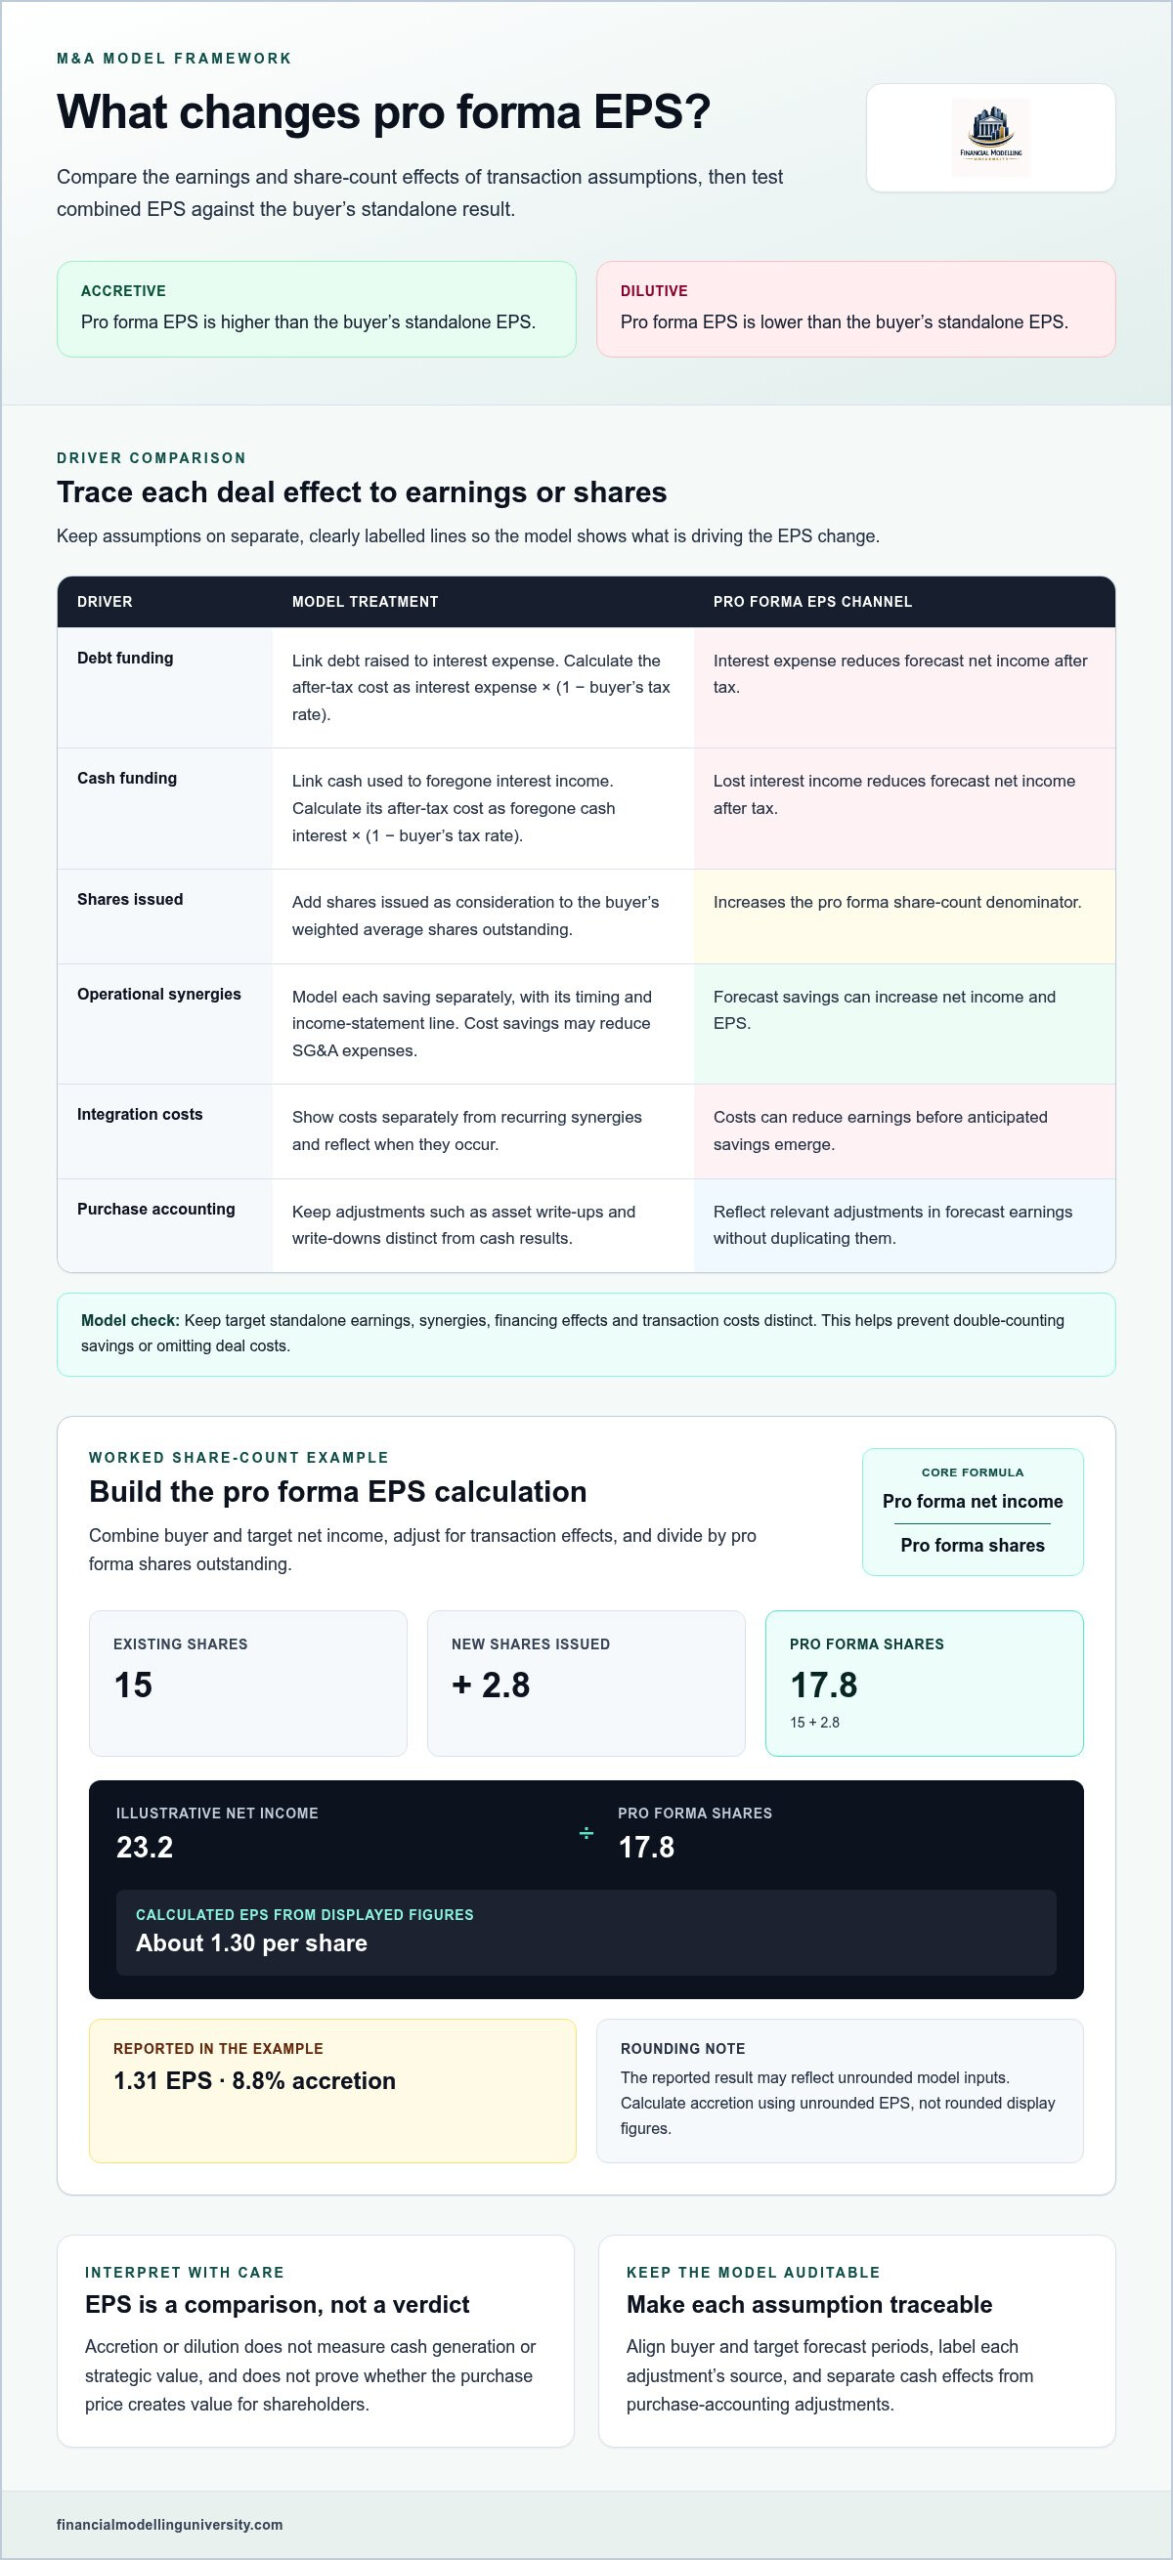
Translate each transaction assumption into a visible income-statement or share-count adjustment. Purchase price, funding mix, tax treatment and exchange ratio can each change pro forma EPS.
Map each adjustment to the pro forma income statement and label its source. Issuing debt can increase interest expense; retiring convertible debt removes its associated interest expense. Other adjustments may include deferred revenue write-downs or previously calculated deferred stock-based compensation expense. Check whether each item changes forecast earnings, shares or both, and avoid including the same adjustment on multiple lines.
Separate transaction expenses from recurring operating costs, then show their timing and income-statement treatment. For financing, calculate after-tax interest expense by multiplying debt interest expense by one minus the buyer’s tax rate. For cash, calculate the after-tax cost by multiplying foregone cash interest by one minus the buyer’s tax rate. These assumptions affect earnings and therefore pro forma EPS.
Enter the debt raised or cash used in the sources and uses schedule, then connect it to interest expense or foregone interest income. In one example, debt issuance increases interest expense by 6.2 in each forecast year. In a separate hypothetical all-cash deal, Company A borrows at a 5% pretax rate, approximately 3.5% after tax. Keep debt balances and interest assumptions consistent.
Recalculate the funding requirement if the purchase price changes: higher consideration may require more debt, cash or newly issued equity. In a stock deal, the exchange ratio determines the shares issued to target shareholders and changes the EPS denominator. Tax, interest and share-count assumptions should reflect the selected financing and consideration. Compare the earnings effect with the added shares before concluding whether the deal is accretive.
Build the workbook in linked layers so transaction assumptions flow into combined earnings and EPS. Keep inputs separate from calculations, and make key outputs easy to trace and audit.
Start with buyer and target forecasts, enter transaction terms and funding, then calculate combined net income and shares. Finish by comparing pro forma EPS with standalone EPS and testing the assumptions that drive the result.
Financial Modelling University’s LBO Financial Models online course extends Excel modelling practice beyond acquisition EPS analysis. It focuses on LBO financial modelling, where financing assumptions connect to debt schedules and investment returns.
The course includes downloadable Excel models and templates, practical exercises and step-by-step video lessons. Use these materials to practise building and checking financial models at your own pace.
Once the base case is complete, challenge its assumptions systematically. Treat an M&A accretion and dilution model as one input to a broader transaction decision, not a verdict on strategic fit or value creation. Build a downside case by reducing expected synergies, delaying their realisation or changing the financing mix. Identify which assumptions move the result most and what evidence supports each one.
Use this review to define practical decision thresholds: the purchase price, financing terms or execution outcomes that would change the recommendation. Document input sources, formula logic and the reason for each adjustment. This keeps the analysis traceable as transaction terms evolve and allows colleagues to test the model independently. Revisit the outputs whenever a key assumption changes instead of relying on an outdated base case.
To develop your financial modelling skills further, explore Financial Modelling University’s courses. Keep testing your assumptions and build each model so its logic is clear, auditable, and ready to inform the next decision.
EPS, or earnings per share, expresses a company’s earnings on a per-share basis. It helps investors assess the profit attributable to each common share, rather than looking only at total income. Interpret it alongside the share count and earnings period: changes in either can move EPS even if underlying business performance has not changed.
Earnings per share is the full term for EPS, a measure of profit attributable to each common share. Basic EPS uses the weighted-average common shares outstanding during the period. Diluted EPS also reflects potential shares from instruments such as options or convertible securities, where applicable. In an acquisition analysis, use a consistent EPS measure for the buyer’s standalone results and the combined forecast.
An M&A accretion and dilution model tests how a proposed merger or acquisition may affect the buyer’s EPS. It helps compare deal structures and forecast scenarios before a decision, but it is not a standalone measure of strategic fit or purchase-price value. Use it to identify the assumptions driving the per-share outcome and where further transaction analysis is needed.
Divide projected combined net income, after relevant transaction adjustments, by the combined company’s pro forma shares outstanding. Use figures from the same forecast period and apply consistent accounting and tax assumptions. Then compare the result with the buyer’s standalone EPS. To calculate the percentage change, divide pro forma EPS by standalone EPS, then subtract one.
Synergies can lift projected earnings when they reduce costs or increase income, while integration spending and transaction fees can reduce earnings. Timing matters: recognising savings before the costs required to achieve them may overstate the near-term effect. Separate recurring operating changes from one-off deal items, and test whether each assumption affects the same forecast period.
Stock funding adds issued shares to the pro forma denominator. Cash funding reduces available cash and may forgo interest income. Debt funding adds borrowing and related interest expense, with tax assumptions affecting the earnings impact. For a mixed-funding transaction, model each source separately, then combine the resulting earnings and share-count effects. This shows which funding choice drives the EPS outcome.