
As a hypothetical example, a report that takes an hour to refresh manually might need only a few well-designed VBA steps to become repeatable. Automating financial reports with VBA can reduce repetitive copying, formatting and calculations while keeping the logic visible in Excel.
Manual spreadsheets are familiar, but repeated edits can make reporting slower and harder to control. The key is to automate a defined workflow, not simply add code: map the inputs, calculations and checks before building a macro. This guide explains how to get started with Excel VBA, compare automated reporting with manual processes, and build a practical financial reporting workflow. You’ll learn to structure source data, handle changing row counts, add basic validation and test the output against an existing report. Start with one recurring report, document its assumptions and exceptions, and expand only after the automated version reconciles.
Choose VBA for Excel-specific workflows, Power Query for importing and reshaping data, Office Scripts for cloud-based Excel tasks, and Python for broader data processing. To import and consolidate financial data with VBA, loop through source files, append matching fields to a central table, then check totals and duplicates.
Enable the Developer tab in Microsoft Excel through File, Options, and Customize Ribbon. Select Developer, then use Visual Basic to create a module for report procedures. Save the workbook as an Excel Macro-Enabled Workbook with the .xlsm extension to retain VBA code. Keep an unchanged copy of the original workbook before testing macros or changing report formats.
Record a macro for a repeatable action, such as applying number formats or setting print areas. Select Developer, Record Macro, perform the steps, then stop recording and inspect the generated code. A recorded macro captures actions, not the reasoning behind them, so test it when the data range changes. Use Power Query to import and reshape structured files before VBA runs calculations or analysis.
Define a consistent layout for every source file, including fields such as account, period, currency and value. In VBA, loop through the files, open each workbook, identify its data range, and append rows to a dedicated staging sheet. Map columns by header names rather than fixed positions. Check for missing periods, duplicate records and control totals before using consolidated data in the report.
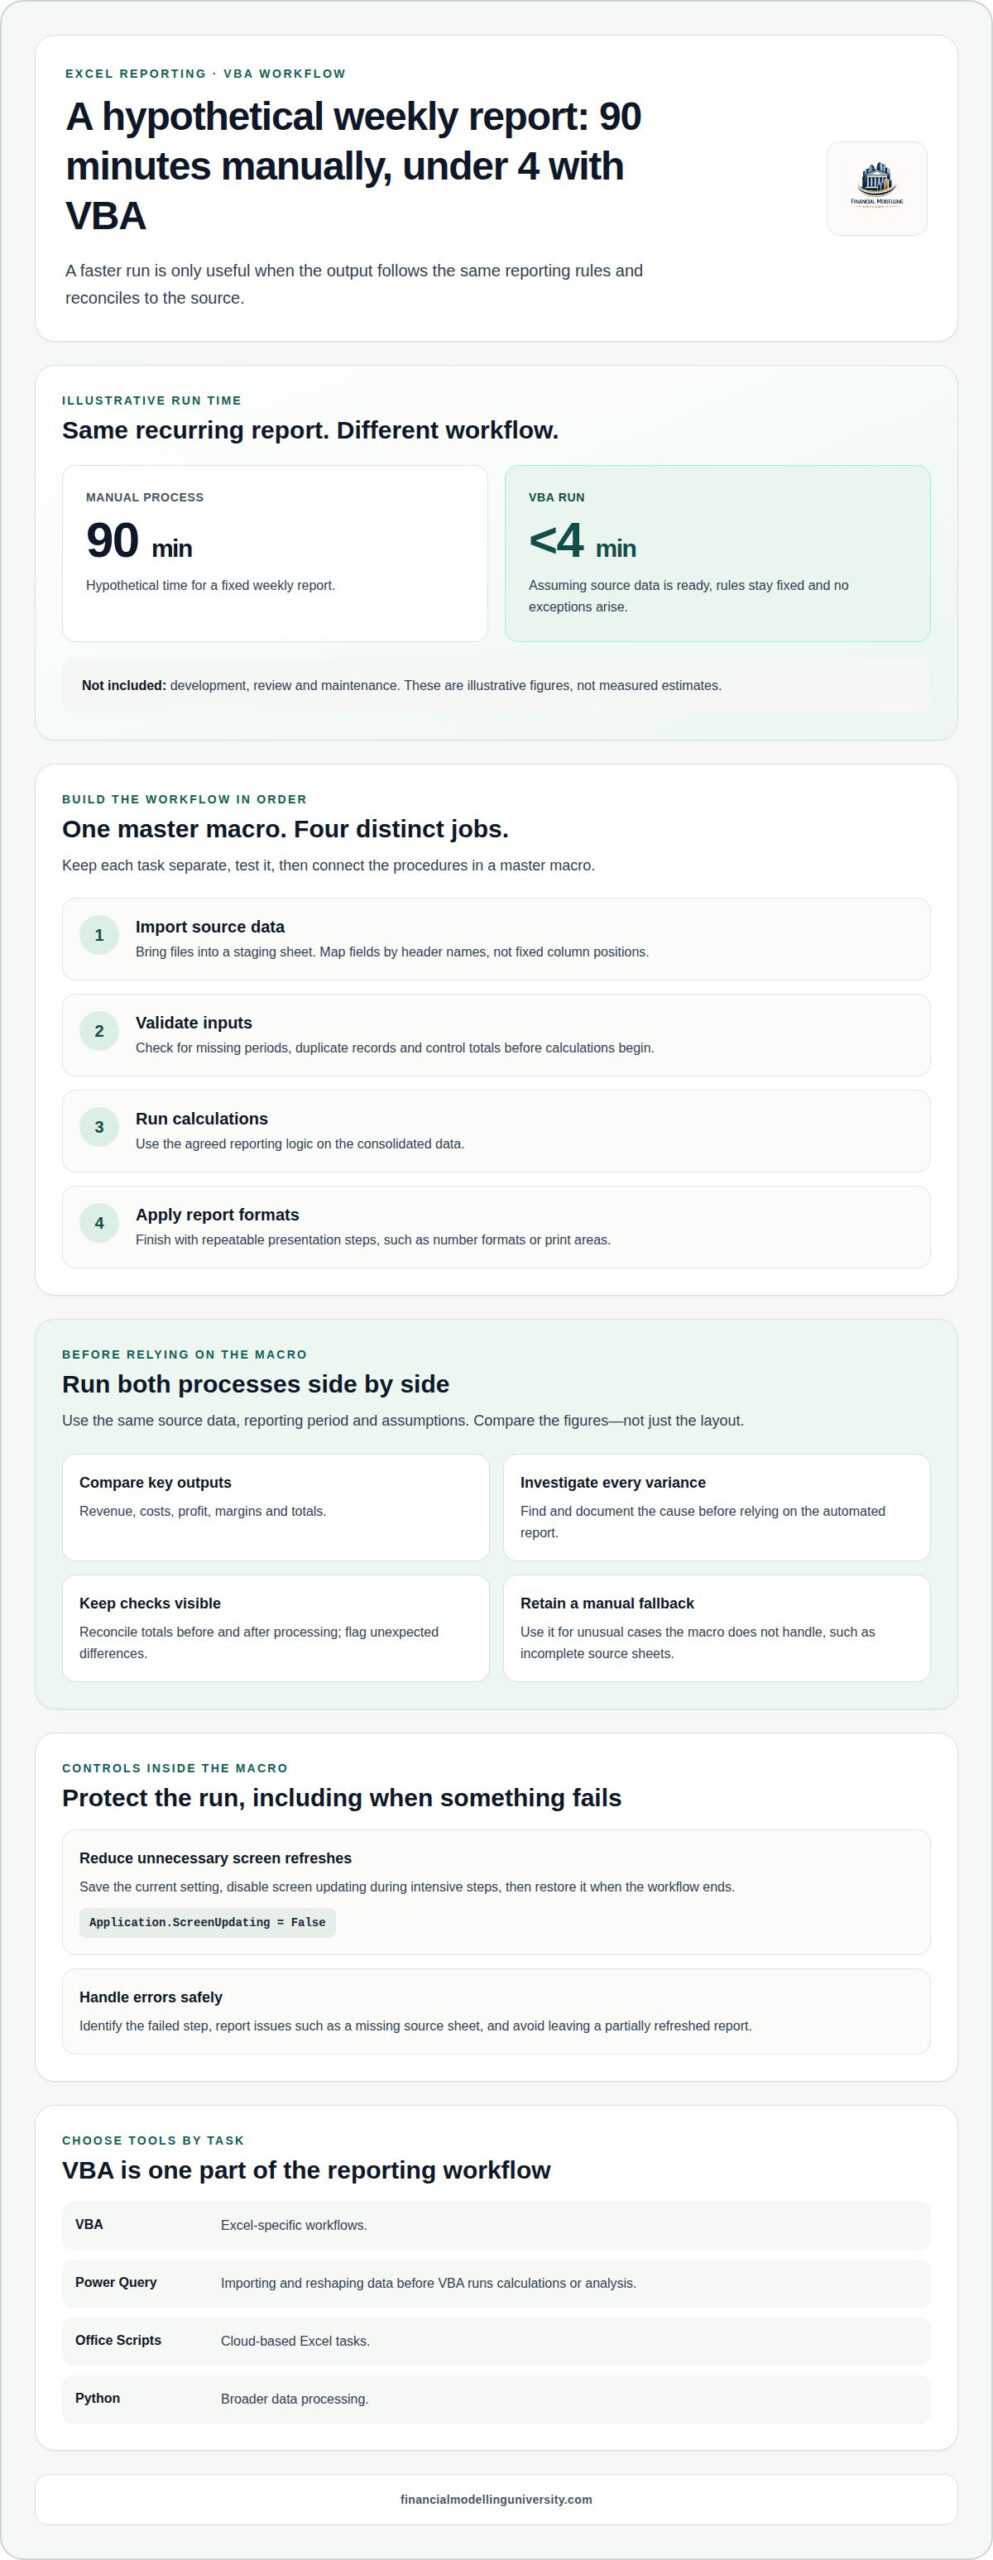
Build a master macro that calls separate procedures for importing data, validating inputs, running calculations and applying formats. Disable screen updating during intensive steps to avoid unnecessary display refreshes, then restore it even if an error occurs. For example, save the current setting, set Application.ScreenUpdating = False, run the procedures, and restore the saved value. Test each procedure before linking the workflow.
Compare the time, control and review points in each workflow before automating. As a hypothetical example, a fixed weekly report might take 90 minutes manually and under 4 minutes to run with VBA, assuming the source data is ready, the reporting rules do not change and no exceptions arise. These times exclude development, review and maintenance.
Run the manual and automated processes side by side for the first cycle. Use the same source data, reporting period and assumptions, then compare key figures across the output sheets. Check revenue, costs, profit, margins and totals, not just whether the layouts look alike. Investigate each variance and document its cause before relying on the macro for reporting.
Map each manual action, from copying source data to applying formats and distributing the report. Mark which steps require judgment and which follow stable rules. VBA handles repeatable Excel tasks consistently, while manual work can adapt more readily when inputs or reporting needs change. A custom macro adds value when the workflow is stable and the time saved justifies maintaining the code.
For illustration only, and assuming the report is fixed, source data is ready and no exceptions arise, a manual process might take 60-90 minutes compared with under 5 minutes to run an automated report. A separate hypothetical example might compare two hours of manual reporting with two seconds to run a macro. These figures exclude setup, review and maintenance and are not measured estimates.
Build safeguards into the workbook before automating report calculations. Add data validation for required inputs, then use error handling to capture failures and restore application settings.
Separate raw data, calculations and report outputs onto clearly named sheets. Use named ranges or dynamic lookups instead of hardcoded row and column numbers, which can point to the wrong data when a source grows. Keep column headers consistent across periods and make formulas refer to those fields. This structure helps a macro find inputs and write results reliably.
Set validation rules for key inputs, such as reporting period, currency and numeric fields. Add reconciliation checks that compare totals before and after processing, and flag unexpected differences rather than silently continuing. Test empty source tabs, missing prior periods and text in fields expected to contain numbers. These cases expose gaps that a clean sample workbook may hide.
Use VBA error handling to capture a failure, identify the affected step and exit safely. For example, an error message can identify a missing source sheet instead of leaving a partially refreshed report. Include a clean-up path that restores Excel application settings, such as screen updating, after an error. Avoid suppressing every error, since that can conceal incorrect formulas or incomplete results.
Place a Workbook_Open procedure in the workbook’s ThisWorkbook module to trigger a report routine when the file opens. Call a separate procedure, such as RefreshReport, rather than putting every calculation inside the event itself. Test with macros enabled and disabled, and prevent the event from overwriting work unexpectedly. For controlled reporting, show a prompt before running the refresh.
Include basic reconciliation checks in the test set. Test VBA reports with empty source tabs, files already open by another person, missing prior periods and text in fields expected to contain numbers. Include all these conditions in the test set.
Automating financial reports with VBA works best when each step has a defined input and result. Map the sequence from source files to reviewed output before writing code. A weekly report, for example, may combine data, calculations and distribution in one controlled workflow.
Build stronger financial modelling skills alongside your reporting workflow with Financial Modelling University courses.
A master routine can call separate routines for importing, checking and formatting, then refresh calculations, update a management dashboard and export a PDF. For a sales report, the workflow can remove duplicate transaction IDs, create calculated fields and summarize revenue, cost, profit and margin.
Financial Modelling University offers online, self-paced courses with structured instruction and practical modelling materials. These can help you build on Excel reporting work by learning how to connect spreadsheet processes with financial modelling assumptions and analysis.
For example, a reporting workflow can support forecasts, valuations or investment analysis. Developing your modelling skills can help make those outputs more useful for decision-making.
Once routine reporting takes less effort, use the time to interpret the results. Ask which operating drivers explain a change in revenue, margin or cash flow, and whether the movement reflects a lasting trend or a timing difference. That analysis turns a report from a delivery task into a stronger input for business decisions.
Automating financial reports with VBA can create space for that judgement, but the value comes from connecting figures to the decisions they inform. Strengthen the modelling skills behind your analysis with relevant financial modelling courses. Keep improving both the process and the questions you ask of its results.
No, you can learn useful VBA by automating a small, familiar Excel task first. Start with a procedure that copies a monthly balance sheet section or applies a standard number format. Then learn variables, loops and conditions as the workflow requires them. Test changes on a copy of the workbook, and compare the result with the original before using the code for live reporting.
The main risks are incorrect outputs, accidental changes to source data and code that works with only one workbook version. A macro might overwrite formulas or process a report with missing inputs. Reduce these risks by keeping source files unchanged, using versioned workbooks and reviewing exception messages. Treat VBA as part of the model’s control environment, not as a substitute for reviewing financial results.
Repeatedly formatting individual cells can slow a large dataset, especially when code also selects ranges or triggers calculation after each change. Apply formats to a whole range in one operation, and avoid unnecessary calls to Select or Activate. Check whether conditional formatting covers unused rows. If calculations dominate runtime, identify the formulas being recalculated before changing calculation settings.
VBA code examples for automating financial statements and reports
A weekly VBA report can import data from three source tabs, calculate period-over-period variance, format the results and prepare the report for distribution. Separate routines can handle importing, checks and formatting, while a master macro runs them in sequence.
Excel VBA financial reporting template examples
A reusable template can use dedicated Raw Data, Mapping and Report tabs, with consistent headers and a separate output area. A sales report example removes duplicate transaction IDs, creates calculated fields and summarizes revenue, cost, profit and margin.