


Two companies can report similar operating earnings yet have different valuation multiples. The difference may reflect depreciation and amortisation, debt, cash, or assumptions used to calculate adjusted earnings. A ratio is useful only when its inputs are consistent.
Enterprise value captures both equity and debt, while the earnings measure determines which operating costs are excluded. This makes enterprise multiples useful for comparing companies with different financing structures, but they do not replace analysis of capital expenditure or cash flow.
This article explains how to calculate and interpret EV/EBIT and EV/EBITDA, select relevant peers, and account for capital intensity. It also shows how to check the calculation and connect the result to the operating assumptions in a valuation model.
Enterprise multiples compare enterprise value with an earnings measure. Choosing EBIT or EBITDA changes how depreciation and amortisation affect the comparison.
An enterprise multiple relates the value of a whole business to an operating measure, rather than comparing share prices alone. Analysts use it for relative valuation because it considers debt and equity together. For an acquirer, this provides a common basis for comparing businesses with different financing arrangements. The earnings measure still matters: EBIT includes depreciation and amortisation, while EBITDA adds them back.
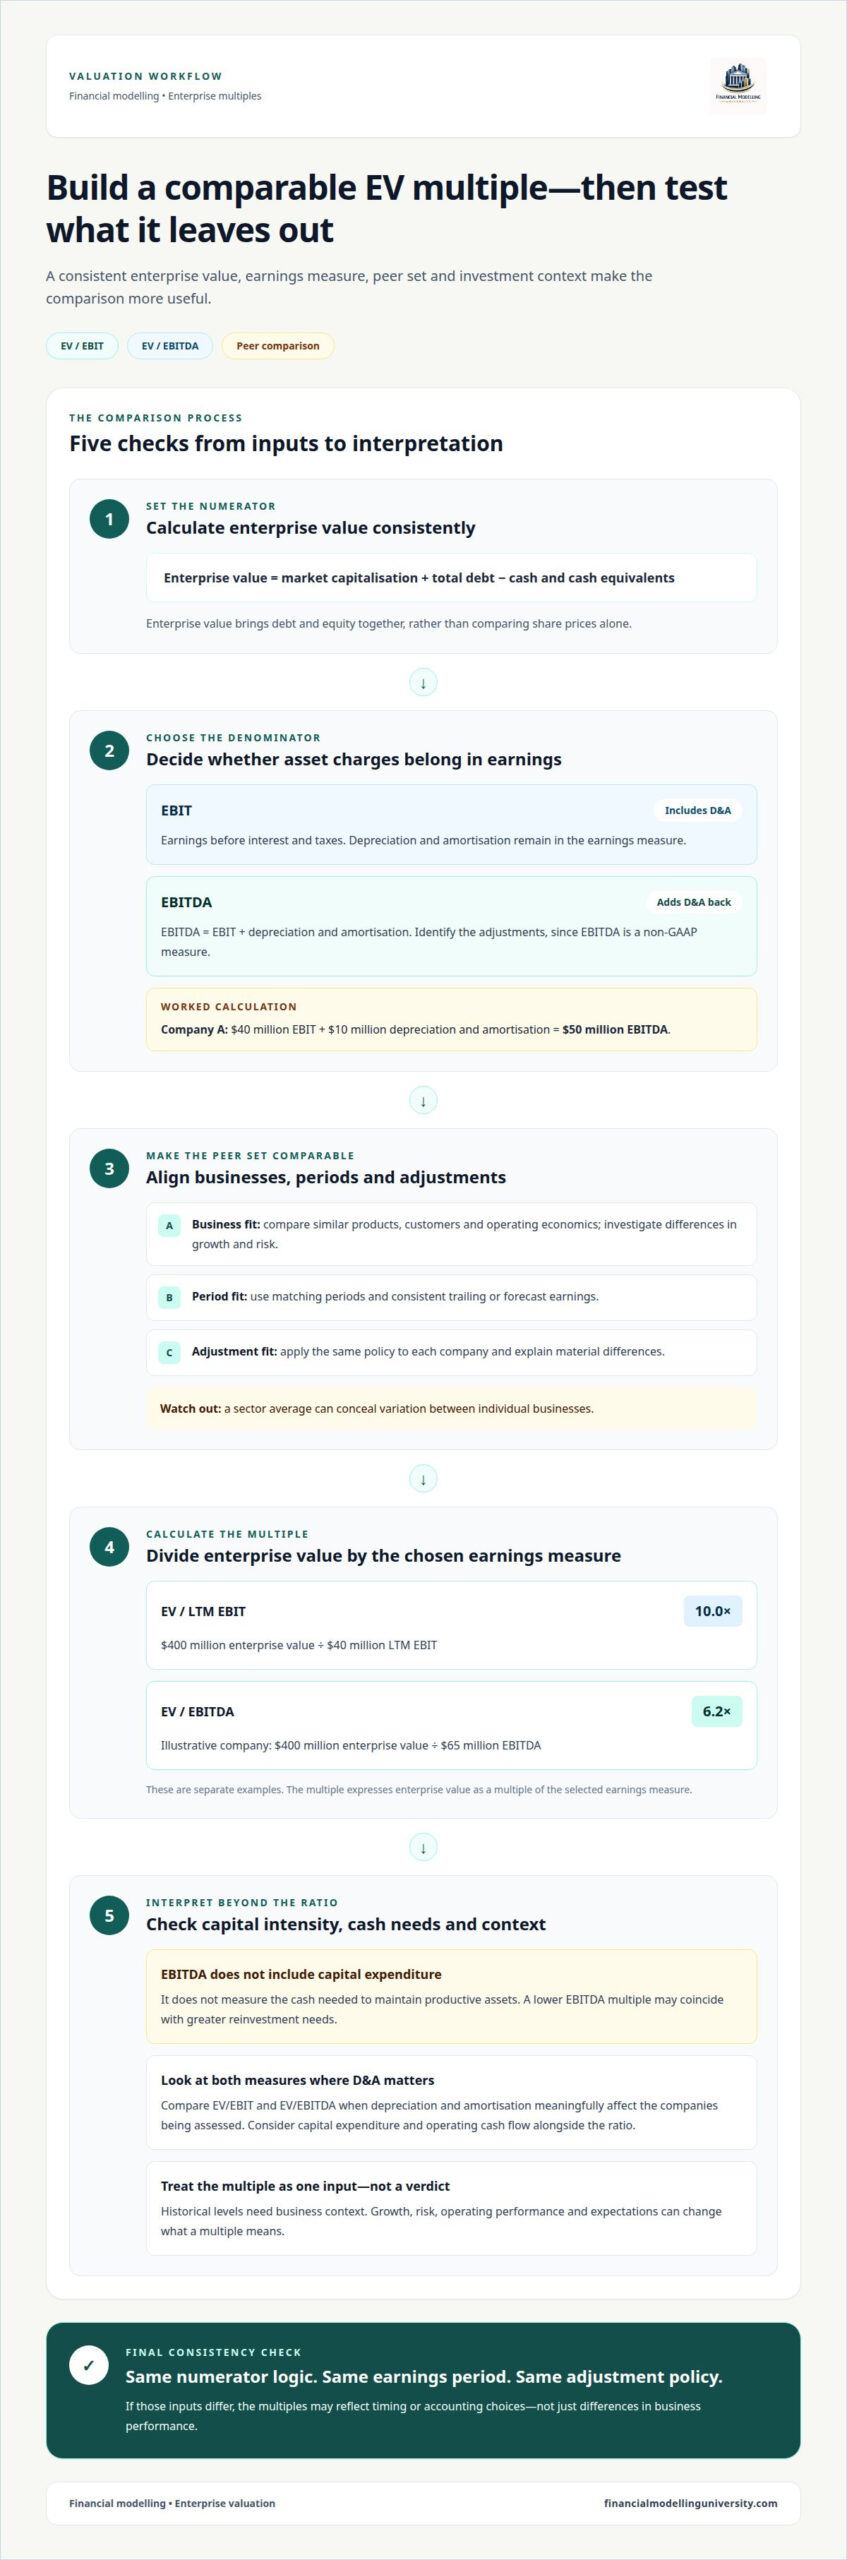
Enterprise value is market capitalisation plus total debt, less cash and cash equivalents. EBITDA means earnings before interest, taxes, depreciation and amortisation; calculate it as EBIT plus depreciation and amortisation. For example, Company A’s $40 million of EBIT and $10 million of depreciation and amortisation produce $50 million of EBITDA. This distinction matters because EBITDA excludes asset charges that remain relevant to operating decisions.
Divide enterprise value by EBITDA to calculate the multiple. The result expresses enterprise value as a multiple of reported or forecast EBITDA. Use figures from matching periods and apply adjustments consistently; otherwise, differences may reflect timing or accounting choices rather than business performance. EBITDA is a non-GAAP measure, so identify the items added back before interpreting the result.
EV/EBIT divides enterprise value by earnings before interest and taxes; EV/EBITDA uses EBITDA instead. With enterprise value of $400 million and LTM EBIT of $40 million, EV/LTM EBIT is 10.0x. Since EBIT includes depreciation and amortisation, it can better reflect asset charges in the earnings denominator. Compare both measures when those charges meaningfully affect the companies being assessed.
A valuation multiple is most informative when peer selection and earnings definitions are consistent. Treat it as one input to company valuation, not a verdict.
Compare companies with similar products, customers and operating economics, then investigate differences in growth and risk. A sector average offers context, but it can conceal variation among individual businesses. For example, an illustrative company with $400 million of enterprise value and $65 million of EBITDA has a 6.2x multiple. Compare that result with genuinely relevant peers, rather than a broad market average, to judge whether its relative valuation looks unusual.
Depreciation policies affect EBIT because they allocate the cost of assets across accounting periods. EBITDA adds depreciation and amortisation back, but different asset lives and investment profiles still matter to the analysis. In one example, operating profit of $50 million, depreciation of $10 million and amortisation of $5 million produce $65 million of EBITDA. Check that peer calculations treat adjustments consistently before comparing their multiples.
Historical multiples show how a company’s current valuation compares with its own earlier trading levels. Use periods with consistent earnings definitions, then assess whether operating performance or expectations have changed. A current 8x multiple, for example, cannot be judged against an older level without considering the business conditions behind each period. Historical trading informs valuation; it does not establish what the company should be worth today.
The price-to-earnings ratio relates equity value to net income, while the enterprise multiple uses enterprise value and EBITDA. How does EV/EBITDA compare with the price-to-earnings ratio? It is less directly affected by leverage and tax differences; P/E reflects interest and taxes through net income. For a high-growth company, either metric can help frame valuation, but investors should compare businesses with similar characteristics and examine the underlying earnings assumptions.
Capital spending affects how well EBITDA represents sustainable earnings. Consider the sector, asset requirements, and purpose of the valuation before interpreting the multiple.
Select peers from the same or an adjacent sector, then match the multiple to the valuation question. A trading comparison, acquisition analysis and valuation of a private business may require different benchmarks. As of Nov 2026, US industry averages included 20.05x for Software – Application, 22.77x for Semiconductors, 5.13x for Oil & Gas Integrated and 4.11x for Aluminum. Those differences show why a broad average can mislead.
Common errors include comparing dissimilar businesses, mixing trailing and forecast earnings, or treating an industry average as a target. Adjusted EBITDA also affects the result: adding valid expenses back increases the denominator and lowers the multiple, while aggressive or inconsistent adjustments can distort comparisons. For a reliable comparison, use the same period and adjustment policy for each company, then explain material differences.
An EBITDA multiple supports relative valuation across companies with different capital structures and tax environments. Its limitations matter for capital-intensive businesses: EBITDA excludes capital expenditure and depreciation, so it does not measure the cash needed to maintain productive assets. A lower multiple may therefore coincide with greater reinvestment needs. Consider capital expenditure and operating cash flow alongside the ratio before assessing profitability.
Growth, profitability, business risk, and capital requirements all influence the multiple investors may accept. Faster expected growth can support a higher valuation, while substantial asset renewal can reduce cash available after operations. Sector economics matter too: the difference between the cited Software – Application and Aluminum averages reflects different market expectations, not a universal rule. Treat each benchmark as context, not a conclusion about value.
Capital-structure neutrality helps investors compare operating performance without letting interest expense dominate the calculation. Enterprise value captures claims held by equity and debt investors, while EBITDA is measured before interest. This supports analysis across companies with different financing structures. It does not make debt irrelevant: borrowing affects risk, and an acquirer considers both debt assumed and cash received.
Consider Company A: market capitalisation is $1 billion, total debt is $200 million, and cash reserves are $100 million. Enterprise value is $1.1 billion: $1 billion plus $200 million, less $100 million. This calculation presents the business value before considering how its capital is divided between equity and debt. Investors can then compare that numerator with operating earnings, using consistent accounting definitions and periods.
Dollar General shows how market movements and operating performance can shift an enterprise multiple over time. Using market capitalisation of $56.2 billion as of April 4, 2022, debt of $14.25 billion, cash of $344.8 million, and trailing-twelve-month EBITDA of $3.86 billion, its multiple was 18.2. At the same time the previous year, it was 17.4. Cash had fallen by nearly $1 billion, while EBITDA had declined by $300 million, contributing to the increase.
This example also shows the limits of the comparison. EBITDA excludes interest, but leverage can still affect enterprise value through perceived financial risk and the return investors require. A capital-structure-neutral calculation isolates an operating comparison; it does not erase financing consequences. For an acquisition analysis, assess debt, cash, and repayment capacity separately. For relative valuation, align EBITDA periods and adjustments before comparing companies. Depreciation and amortisation add-backs also require consistent treatment, or accounting differences can weaken the comparison.
Financial Modelling University helps you turn valuation concepts into structured Excel analysis. If you’re building a DCF or comparing enterprise multiples, practise linking operating assumptions to financial statements and valuation outputs instead of treating a multiple as a standalone answer.
The DCF & Valuation and LBO Financial Models online courses include step-by-step video lessons, practical financial modelling exercises, and downloadable Excel models and templates. Use these materials to practise how earnings assumptions, valuation methods, and financing choices affect model outputs. They can help you build or strengthen your valuation modelling skills alongside the analysis in this article.
Contact Financial Modelling University to discuss your financial modelling learning goals.
Turn your analysis into a decision-ready model. Forecast the operating drivers behind revenue, margins, and reinvestment, then trace their effects through cash flow. This helps explain why an EV/EBITDA result changes across scenarios instead of presenting a single multiple without context.
Use the EV/EBITDA multiple as one output in a broader model, not as a substitute for testing assumptions. Keep inputs visible, separate calculations from assumptions, and make the logic easy for another analyst to follow. Sensitivity analysis can show how changes in operating performance affect valuation and highlight which assumptions deserve closer attention.
Build these skills through structured financial modelling practice. Explore Financial Modelling University’s courses and choose a learning path that supports your next modelling goal. Keep testing your assumptions and communicating your analysis clearly.
It is a valuation ratio that relates a company’s enterprise value to its EBITDA. Analysts use it to compare businesses, but the result depends on the earnings period and adjustments used. For example, a French automotive supplier with normalized EBITDA of EUR 8 million and a 5.0x multiple implies enterprise value of EUR 40 million. Normalized earnings should reflect a consistent, explainable basis.
An enterprise multiple compares enterprise value with an operating measure, commonly EBITDA or EBIT. It helps investors assess the value of the whole business against its earnings, rather than focusing only on equity value. For a useful comparison, keep the earnings measure and reporting period consistent across companies. Then interpret differences in light of operating performance and business risk.
EV means enterprise value, a measure of the value attributable to a company’s debt and equity holders after accounting for cash. It is useful in acquisition analysis because an acquirer takes on debt and receives cash as part of the transaction economics. It differs from market capitalisation, which represents the market value of shareholders’ equity alone.
Divide enterprise value by EBITDA to calculate the ratio. Use figures from the same valuation date and earnings period, such as trailing-twelve-month EBITDA or a forecast period. If an analyst uses adjusted EBITDA, apply the adjustments consistently across the comparison set. The resulting multiple expresses enterprise value as a factor of the selected earnings measure.
Use this calculation: enterprise value = market capitalisation + total debt − cash and cash equivalents. Add debt because it represents a claim on the business, then subtract cash because it reduces the net amount an acquirer effectively pays. Use figures measured at compatible dates. If a valuation includes other claims or non-operating assets, assess separately whether they belong in the calculation.
There is no single good ratio across industries; compare a company with relevant sector peers and consider its growth, risk and reinvestment needs. As of Nov 2026, US industry averages included 23.92x for Diagnostics & Research, 22.77x for Semiconductors, 6.55x for Marine Shipping and 4.11x for Aluminum. These averages are benchmarks, not automatic valuation targets.