


Your choice of a peer group isn’t just a spreadsheet exercise; it’s a strategic narrative that determines whether your valuation survives a Managing Director’s review. You likely know the frustration of staring at a screen, wondering if a 15.70x EV/Revenue multiple for a semiconductor firm actually applies to your target or if the SEC’s 2026 reporting threshold changes have fundamentally shifted your data pool. It’s common to feel anxious when defending a specific multiple during a high-stakes technical interview or a client presentation.
We understand that finding truly “comparable” companies is often more art than science. This guide will transform that uncertainty into institutional-grade confidence. You’ll master the art of comparable company analysis by learning the exact, repeatable workflow used by elite investment banking professionals to spread comps and defend their conclusions. We’ve designed this to help you perform at the level of the top 1% of finance practitioners.
In this definitive guide, we’ll dive into advanced peer selection, the nuances of the latest FASB Topic 820 updates, and the Excel techniques required to build a dynamic, error-free valuation model. You’ll move from basic data entry to mastering the strategic insights that drive multi-billion dollar deals.
Comparable company analysis is the bedrock of relative valuation in investment banking. It operates on a straightforward, market-driven logic: companies with similar business models, growth profiles, and risk characteristics should trade at similar valuation multiples. Instead of projecting cash flows into an uncertain future, CCA looks at how the public market values the peer group today to determine the fair value of a target firm. It’s a foundational skill for anyone looking to Master Financial Modeling Like the Pros.
Investment professionals consider CCA the gold standard for pricing Initial Public Offerings (IPOs) and benchmarking M&A deals. It provides a real-time pulse on investor appetite that theoretical models simply cannot replicate. By utilizing Valuation Using Multiples, analysts bypass the noise of individual stock fluctuations to find a consensus value based on aggregate market intelligence. This methodology ensures that a valuation isn’t just mathematically sound but also market-defensible.
Intrinsic valuation, such as a DCF model, relies on the law of math to find value. CCA relies on the law of the market. While a DCF tells you what a company is worth based on its future cash flows, comparable company analysis tells you what the market is actually willing to pay right now. This makes it an essential sanity check. If your DCF outputs a valuation significantly higher than the trading multiples of every direct competitor, your terminal growth assumptions are likely too aggressive.
CCA becomes particularly reliable in volatile sectors or early-stage industries where long-term cash flow projections are speculative. In these scenarios, seeing that a peer group trades at a median 11.41x EV/Revenue multiple provides a more defensible valuation floor than a 10-year forecast built on assumptions. Expert analysts use both methods to create a valuation football field that captures a range of possible outcomes, ensuring they don’t rely on a single, potentially flawed data point.
Trading comps reflect the here and now. They represent the minority-interest value of a company based on current stock prices in liquid markets. In contrast, precedent transactions analyze historical acquisition prices. These often include a control premium, which is the extra amount an acquirer pays to own the entire business. Trading comps are usually lower than precedent multiples because they lack this premium. Use trading comps to understand current market sentiment and precedent transactions to estimate what a strategic buyer might pay in a takeover scenario.
Selecting a peer group is the most scrutinized step in any valuation. Don’t rely solely on GICS or SIC codes to identify competitors. These industry classifications are often too broad and fail to capture the nuances of a company’s specific business model. A professional analyst digs deeper to ensure the “comparable” label is actually earned. Your goal is to build a “tight” peer group, typically consisting of 5 to 10 companies. A larger group often introduces firms with different risk profiles, while a smaller group makes your median multiple vulnerable to outliers.
Focus on finding “Pure Play” peers whenever possible. These are companies that operate in a single line of business, making their valuation multiples easier to interpret. If you must include conglomerates, you’ll need to account for their diverse revenue streams, which often result in a “conglomerate discount.” Mastering this selection process is a core component of our Investment Banking Financial Modeling Course, where we teach you to think like a senior associate.
The first filter is qualitative. Evaluate the company’s product mix, service offerings, and end markets. Geography also serves as a critical filter. A software firm based in the U.S. and one based in an emerging market might offer similar products, but they face vastly different regulatory and currency risks. To find this data, use the SEC EDGAR Database to review the “Business” section of 10-K filings. This is where you’ll discover competitive moats and brand equity that might justify a premium multiple compared to the rest of the sector.
Once you have a list of potential business peers, apply quantitative filters. Size matters. Investors treat a company with $10 billion in revenue differently than a $100 million micro-cap firm due to liquidity and risk profiles. Market capitalization should ideally be within a similar range to ensure the comparison is valid. Growth rates are the primary driver of valuation multiples; high-growth firms naturally command higher multiples than mature cash cows. If you’re looking to refine your skills, our curriculum provides the tools to handle these complex adjustments with professional precision.
Secondary filters include profitability margins like EBITDA and Net Income. If your target company has a 30% EBITDA margin while the peer group averages 15%, you must decide if the target deserves a premium or if the peers are truly comparable. This level of detail is what separates a student from an elite industry practitioner.
Standardizing market values into multiples is the only way to perform a meaningful comparable company analysis. Without this standardization, you cannot compare a large-cap industry leader to a mid-cap challenger. Your choice of multiple defines the narrative of your valuation. It tells the story of whether a company’s value lies in its top-line growth, its operational efficiency, or its underlying asset base. To understand the academic foundation of these choices, review the Relative Valuation Principles established by industry authorities.
Every sector has a “universal language” for value. In 2026, we see vast differences in how the market rewards different industries. For instance, high-growth sectors like Software (System & Application) trade at a median EV/Revenue multiple of 11.41x, while the Semiconductor sector commands 15.70x. In contrast, capital-intensive or mature industries, such as Integrated Oil & Gas, trade at much lower EBITDA multiples, recently recorded at 3.33x. Selecting the wrong metric leads to a valuation that no MD or client will take seriously.
Enterprise Value (EV) multiples are the preferred choice for professional analysts because they’re “capital structure neutral.” This means they look at the value of the entire business, regardless of how it’s funded with debt or equity. EV/EBITDA is the gold standard here. It serves as a reliable proxy for operating cash flow by stripping away the effects of taxes, interest, and non-cash accounting items like depreciation. For high-growth SaaS firms where profitability is years away, EV/Revenue remains the primary metric for comparison.
Use EV/EBIT instead of EBITDA when valuing businesses with high capital expenditures. Since EBIT accounts for depreciation, it reflects the ongoing cost of replacing the assets required to generate revenue. This is critical in industries like manufacturing or telecommunications where “maintenance capex” is a significant drain on cash.
Equity Value multiples focus strictly on what is available to shareholders after all debt obligations are met. The Price-to-Earnings (P/E) ratio is the most common metric, but it’s easily distorted by different capital structures and tax rates. It’s best used for mature companies with stable earnings. If you’re comparing firms with different growth trajectories, use the PEG ratio to adjust the P/E for expected earnings growth. This provides a more balanced view of whether a stock is truly overvalued.
Price-to-Book (P/B) is essential when the company’s value is tied to its balance sheet. This is the primary metric in Real Estate Financial Modeling and banking. In these sectors, assets are often marked to market, making the book value a relevant floor for valuation. For example, as of mid-2026, Banks trade at a median EBITDA multiple of 11.83x, but their P/B ratio remains the definitive benchmark for institutional investors.
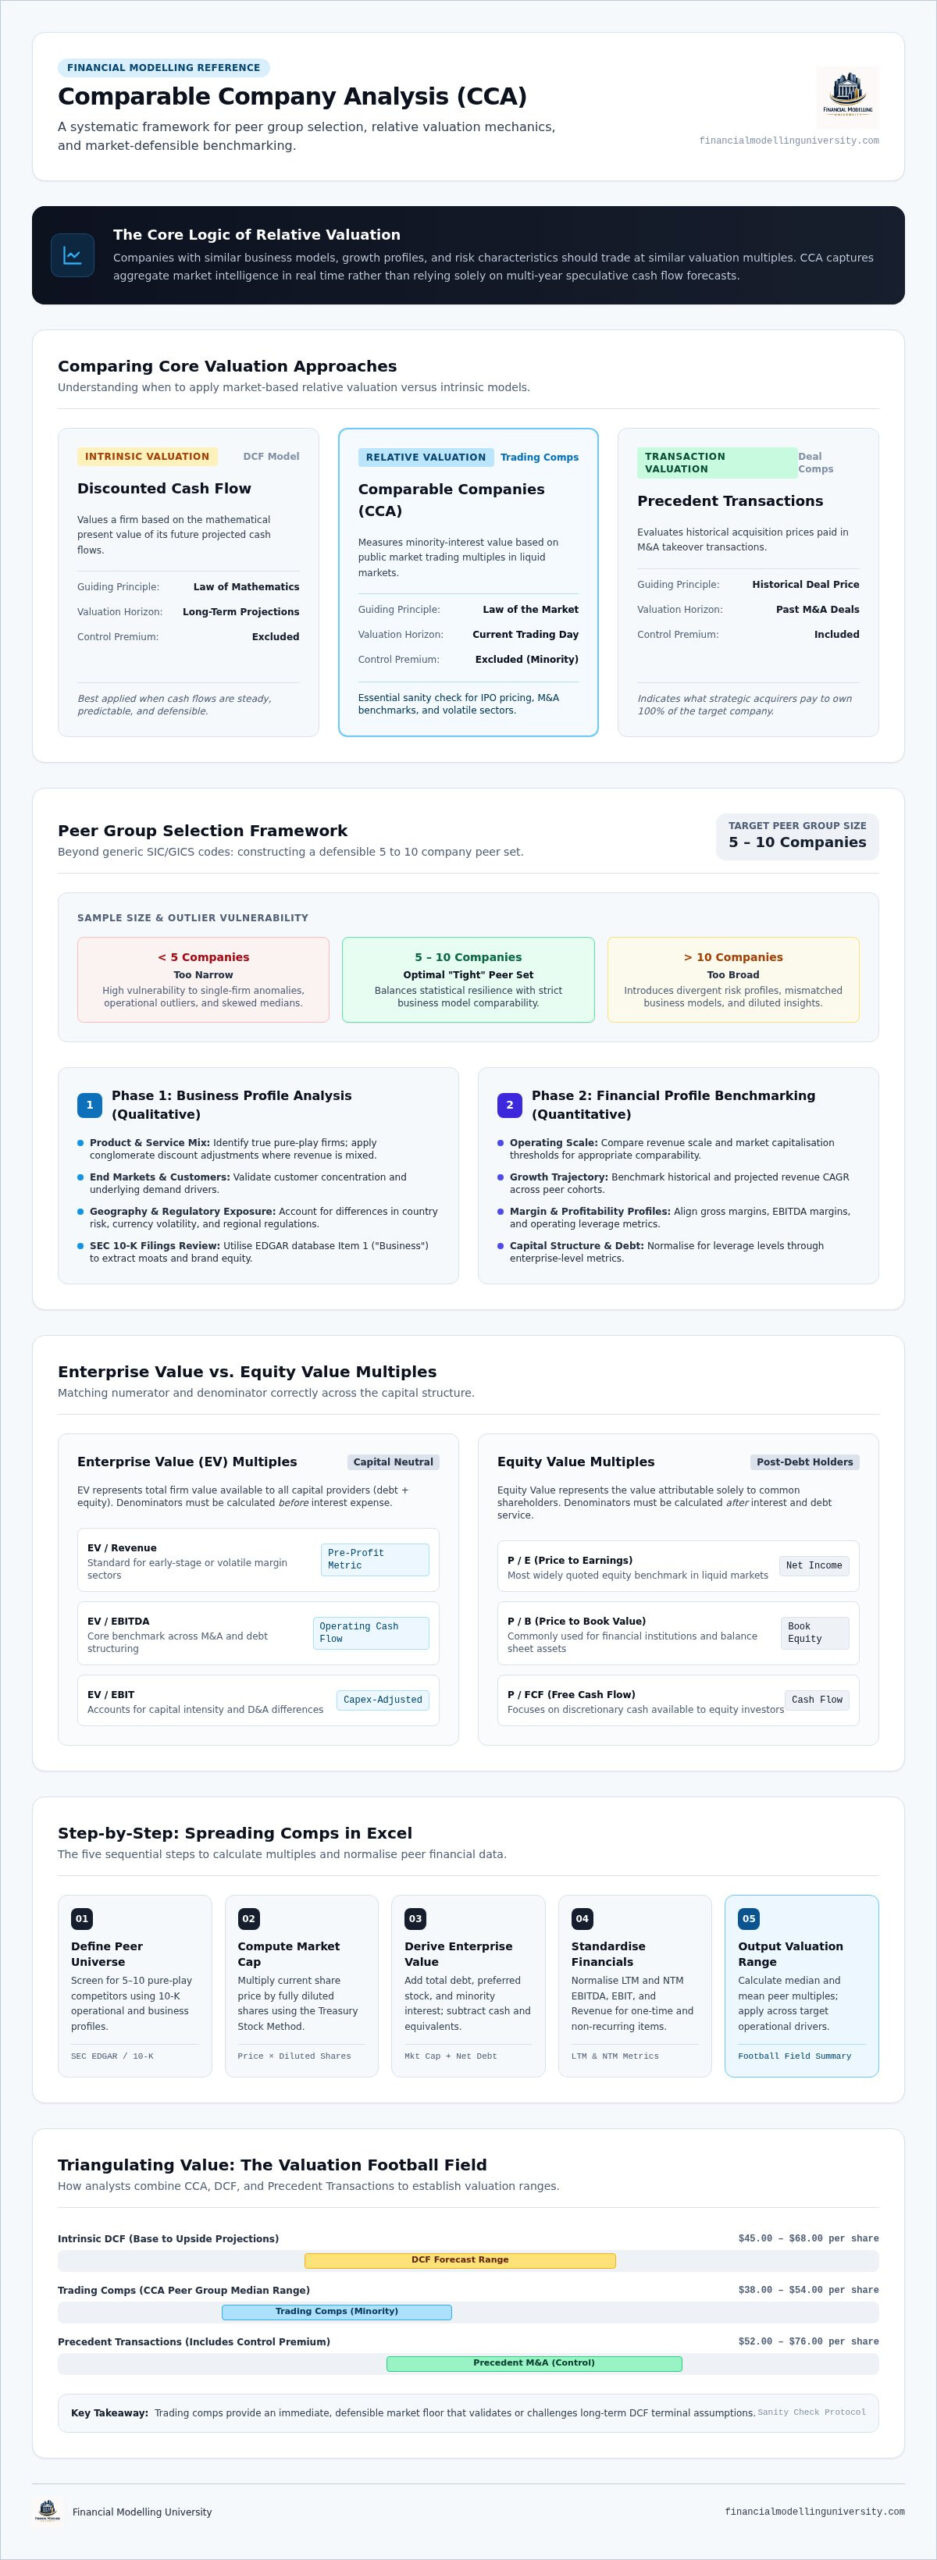
Spreading comps is the technical core of comparable company analysis. It’s where you translate raw SEC filings into a clean, actionable valuation range. Start by building a dedicated “Comps Universe” tab in your Excel model. This tab should be structured to pull in market data and financial statement line items for each peer in your group, which can be efficiently gathered using tools like GoodMoat. Accuracy here is paramount; a single error in your share count or net debt calculation will ripple through your entire valuation.
Begin with market data. You’ll need the current share price and the total diluted shares outstanding, which requires applying the treasury stock method to account for in-the-money options and warrants. Next, calculate Enterprise Value by adding Net Debt (Total Debt minus Cash and Equivalents) to the Market Cap. To perform this like a professional, download our Excel for Finance Course templates, which are pre-built to handle these institutional-grade calculations.
Data normalization is the step most junior analysts miss. You must “clean” the EBITDA for non-recurring items. If a company recorded a $20 million restructuring charge or a one-time gain from an asset sale, you must adjust the reported figures to reflect the true underlying earnings power of the business. This ensures your multiples aren’t distorted by noise that won’t repeat in future periods.
Static fiscal year data is often outdated by the time you perform your analysis. Professionals use the “stub period” methodology to calculate LTM figures. This involves taking the most recent fiscal year results, adding the current year-to-date (YTD) performance, and subtracting the equivalent YTD results from the previous year. This process ensures your analysis reflects the most recent four quarters of performance, which is vital in fast-moving sectors like Semiconductors where the 2026 median EBITDA multiple sits at 17.28x.
Once your multiples are calculated, look at the aggregate data. Never rely on the mean; a single outlier can easily skew the average. Instead, focus on the median to identify the true market consensus. Use the 25th and 75th percentiles to define your valuation range. This range is then plotted on a “Football Field” chart, allowing you to visualize how your comparable company analysis results stack up against other methodologies like a DCF or precedent transactions. This visual summary is what you’ll ultimately present to senior leadership to defend your valuation conclusion.
Mastering comparable company analysis is often the deciding factor in high-stakes technical interviews at top-tier firms. Recruiters aren’t just looking for someone who can define a multiple; they want to see a “Strategic Architect” who understands the narrative behind the numbers. You must demonstrate that you can defend your peer selection against rigorous questioning. If an interviewer asks why you chose a 15.70x semiconductor multiple over a lower industry average, your answer needs to reflect a deep understanding of growth profiles and risk factors. This level of precision is what separates elite candidates from the rest of the applicant pool.
Transitioning from a student to a professional requires more than just memorizing formulas. Institutional-grade modeling demands a disciplined, repeatable workflow that ensures accuracy under pressure. At Financial Modelling University, we’ve trained over 25,000 finance professionals to perform at this level. By leveraging the FMU All-Access Pass, you gain the blueprint for this career transformation. You’ll move beyond basic data entry to master the nuances that senior MDs expect from their associates.
Recruiters at bulge-bracket banks value proof of technical expertise. Using FMU certificates validates that you’ve mastered institutional-grade techniques used by the industry’s top 1%. You should arrive at every interview with a “deal-ready” Excel portfolio that showcases your ability to spread comps, normalize EBITDA, and build dynamic football field charts. This tangible evidence of your skills makes you a low-risk, high-reward hire. It also gives you the confidence to discuss complex valuation nuances when interviewing for a job at JP Morgan or other elite institutions.
Ready to perform like an industry insider? Enroll in the Investment Banking Financial Modeling Course to master CCA today. Stop practicing on generic tutorials and start using the institutional-grade tools that drive real-world deals.
Mastering comparable company analysis is the definitive step toward professional maturity in finance. You’ve learned that selecting a peer group requires more than just checking industry codes; it demands a deep understanding of business risk and financial profiles. By normalizing EBITDA and applying the stub period methodology for LTM data, you ensure your valuation stands up to the highest levels of institutional scrutiny. These aren’t just technical skills. They’re the building blocks of a career defined by precision and authority.
The path to becoming a Strategic Architect at a top-tier firm is structured and disciplined. Don’t leave your career transformation to chance or generic tutorials. Join the 25,000+ finance professionals who have already elevated their skills through our globally recognized certificates. Our expert-led curriculum, designed by Wall Street veterans, provides the blueprint you need to excel in the fast-paced world of investment banking.
Take the next step in your professional journey. Master Institutional-Grade Financial Modeling with FMU and start performing at the elite level today. You have the tools and the framework; now it’s time to build your legacy.
The main advantage of comparable company analysis is its reliance on real-time market data rather than theoretical assumptions. It provides a reality check against intrinsic models by reflecting what investors are currently willing to pay for similar assets. This methodology is highly defensible in M&A and IPO scenarios because it uses observable multiples from liquid markets. It bypasses the sensitivity issues found in long-term forecasting, offering a pragmatic benchmark for immediate valuation.
Select peers by prioritizing business and financial profile alignment over simple industry codes. Evaluate product offerings, end markets, and geographic exposure first. Then, filter by financial metrics such as revenue scale and EBITDA margins. A professional peer group typically includes 5 to 10 companies. Use the SEC EDGAR Database to verify that your selected firms share similar risk and growth characteristics, ensuring your valuation remains robust and credible.
EV/EBITDA is preferred because it is capital structure neutral, meaning it ignores how a company is financed. Unlike the P/E ratio, which is distorted by varying interest rates and tax regimes, EV/EBITDA focuses on core operating performance. This allows for a direct comparison between firms with different debt levels. It serves as a superior proxy for cash flow, especially in capital-intensive industries where depreciation and interest expenses vary significantly between competitors.
Adjust for non-recurring items by normalizing the financial statements to reflect ongoing operations. Add back one-time expenses like restructuring charges, legal settlements, or M&A integration costs to the reported EBITDA. Conversely, subtract one-time gains from asset sales or insurance payouts. This process prevents temporary noise from skewing your comparable company analysis. Professionals must meticulously review footnotes in 10-K filings to identify these adjustments and ensure the multiple reflects sustainable earnings power.
If no pure play peers exist, expand your search to include companies with similar business segments or risk profiles. You might need to use a Sum-of-the-Parts valuation or apply a conglomerate discount to account for diversified revenue streams. Document your reasoning for each inclusion and adjust your target multiple based on the qualitative differences. Mastering these complex scenarios is a hallmark of an elite analyst who can navigate imperfect data with professional judgment.
Neither methodology is objectively better; they serve as complementary tools. CCA provides a market-based valuation reflecting current sentiment, while DCF offers an intrinsic value based on projected cash flows. A DCF is sensitive to terminal growth and WACC assumptions, whereas CCA is vulnerable to market bubbles or irrationality. Professional analysts use both to create a valuation range, ensuring the final conclusion is supported by both mathematical rigor and market reality.
Calculate LTM EBITDA using the stub period methodology to ensure your data is current. Take the EBITDA from the most recent fiscal year, add the EBITDA from the current year-to-date period, and subtract the EBITDA from the same year-to-date period of the previous year. This formula captures the most recent four quarters of operational performance. It is essential for accurately valuing companies experiencing significant recent shifts in profitability or growth.
A Football Field chart is a visual summary that displays valuation ranges from various methodologies on a single graph. It typically shows the results of your comparable company analysis alongside DCF, precedent transactions, and 52-week trading ranges. This chart allows senior MDs to quickly identify where different valuations overlap. It provides a clear, professional way to defend a target price by demonstrating consensus across multiple institutional-grade analytical frameworks.