

A high Return on Equity looks impressive on a pitch deck, but it is often a mask for unsustainable leverage rather than operational excellence. You’ve likely felt the heat in an interview or a deal review when a senior partner asks exactly which lever drove a ratio shift and your answer felt thin. It’s one thing to calculate a percentage; it’s another to explain the “why” behind the numbers with the authority of an industry insider. At FMU, we know that true mastery requires moving beyond surface-level metrics to find the signal in the noise.
This guide will teach you how to master the dupont analysis to deconstruct ROE into actionable performance drivers like a Wall Street professional. You’ll learn to execute the 3-step and 5-step frameworks, accounting for the current 21% federal corporate tax rate and the impact of the 3.5% to 3.75% federal funds rate on financial leverage. We’ll show you how to build a dynamic diagnostic in Excel that links directly to your financial model outputs. By the end, you’ll confidently identify whether a company is scaling through genuine margin expansion or dangerous debt, ensuring you always Master Financial Modeling Like the Pros.
Key Takeaways
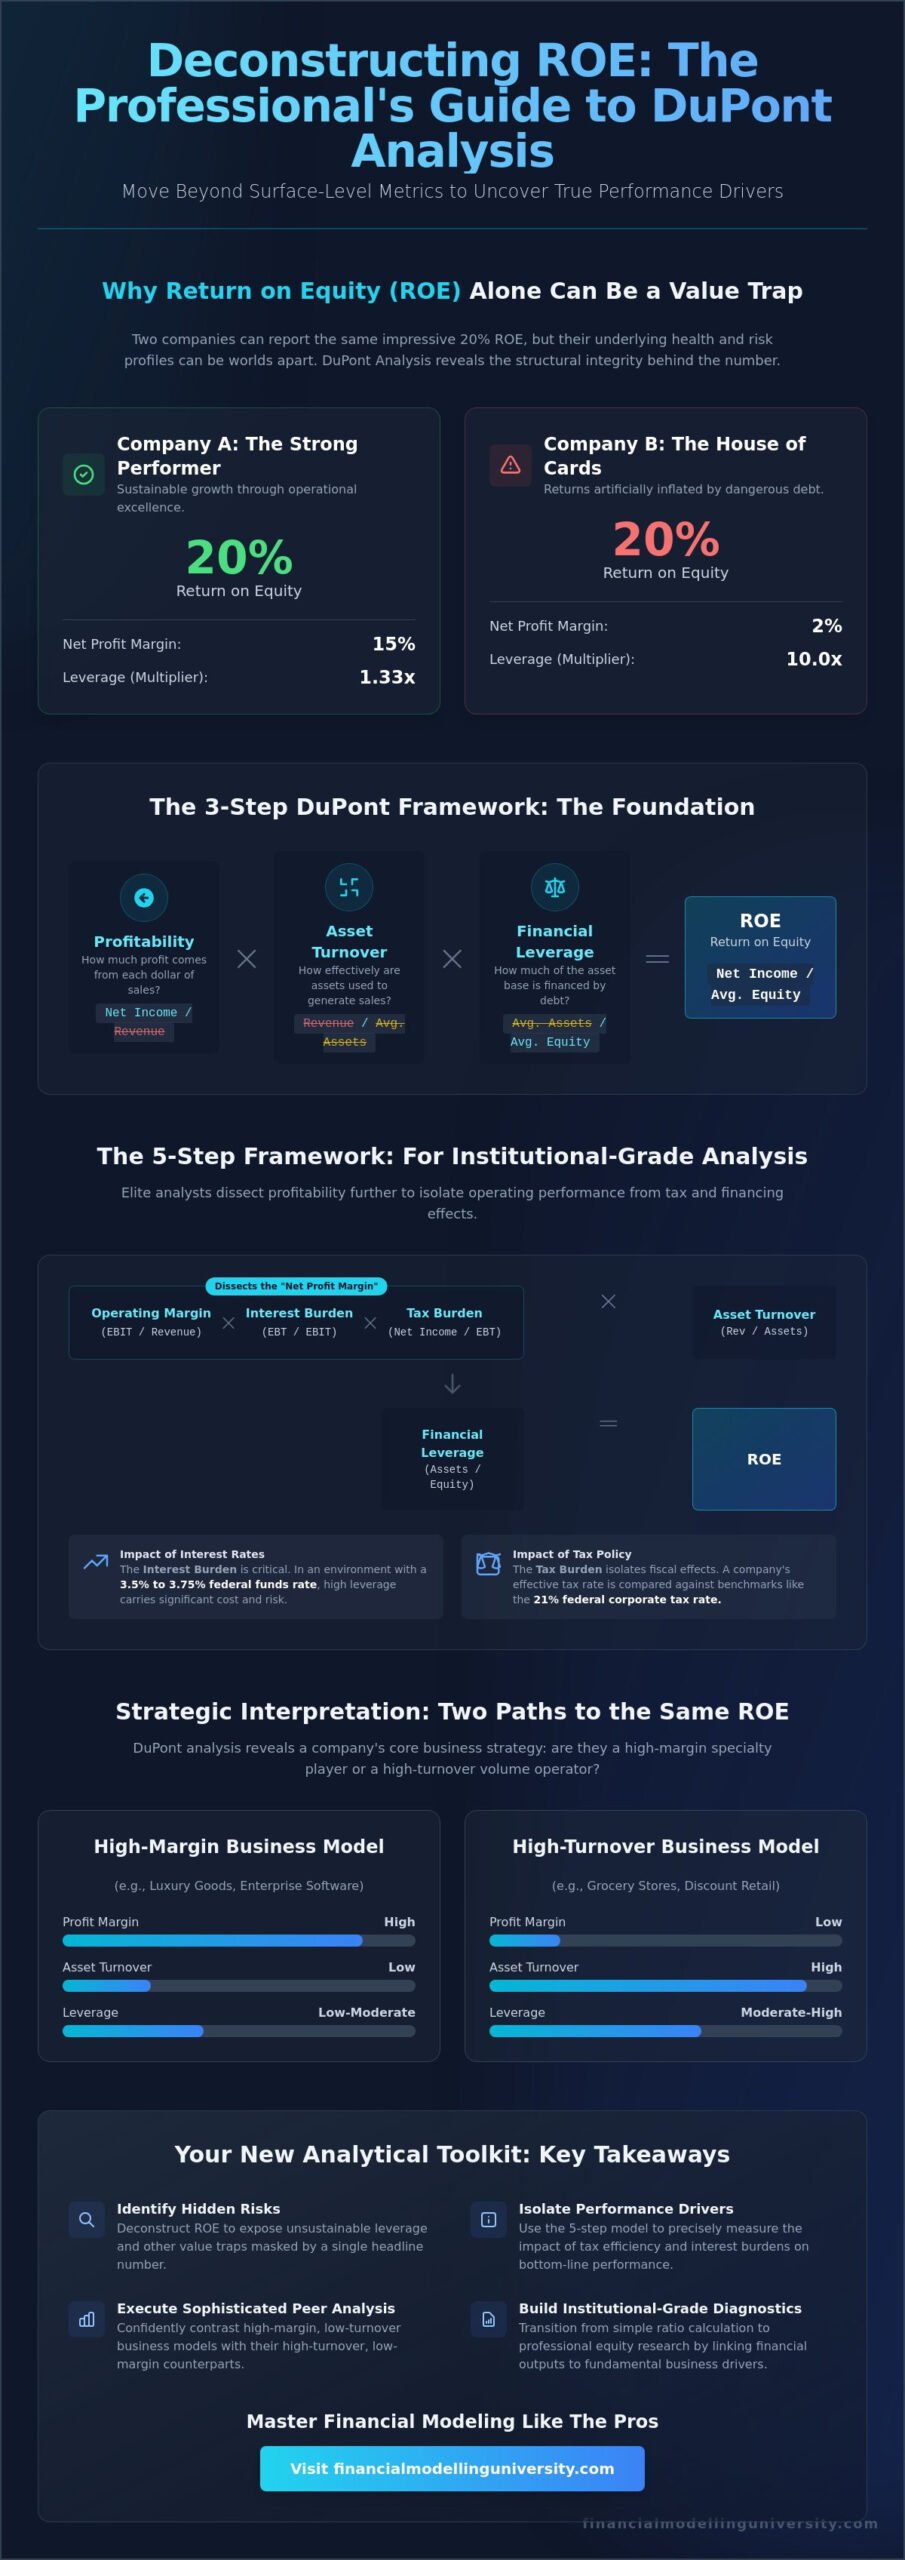
- Identify hidden risks by deconstructing Return on Equity into its core operational and financial components to expose leverage-driven value traps.
- Deploy the 5-step dupont analysis to isolate the precise impact of tax efficiency and interest burdens on bottom-line performance.
- Execute sophisticated peer group analysis by contrasting high-margin business models with high-turnover operational structures.
- Build institutional-grade Excel diagnostics using average balance sheet figures to eliminate timing mismatches in your financial models.
- Transition from simple ratio calculation to professional equity research by linking financial outputs to fundamental business drivers.
The Diagnostic Power of DuPont Analysis: Why ROE Alone is Deceptive
Elite financial modeling requires more than just filling out a spreadsheet. You need to understand the mechanics beneath the surface of every ratio. The dupont analysis, pioneered by Donaldson Brown at the DuPont Corporation in 1914, provides that depth. It is a multi-stage decomposition of Return on Equity (ROE) that separates operational success from financial engineering. For a comprehensive DuPont analysis overview, one can see how it has evolved from a simple internal management tool into a standard diagnostic for investment professionals globally.
A high ROE often signals a healthy company, but it can also be a dangerous value trap. If a firm generates a 25% ROE primarily through massive debt rather than high margins or efficient asset use, it’s a house of cards. In an environment where the federal funds rate sits between 3.5% and 3.75%, that leverage carries a real cost. The framework forces you to evaluate the three core pillars of corporate performance: Profitability, Efficiency, and Leverage. Without this breakdown, you’re flying blind.
The Limitations of Single-Ratio Analysis
Top-tier analysts never view ROE in isolation. Imagine two companies both reporting a 20% ROE. Company A achieves this through a 15% net profit margin and low debt. Company B achieves it with a 2% margin but 10x leverage. Their risk profiles are worlds apart. DuPont analysis is the X-ray of the balance sheet for investment professionals, revealing the structural integrity of a company’s returns. It prevents you from being misled by a single “bottom line” figure that might hide underlying insolvency or operational decay.
The 3-Step Model: The Foundation of Corporate Finance
The 3-step model serves as the starting point for any professional diagnostic. It breaks ROE into three distinct components that map directly to the financial statements:
- Net Profit Margin (Profitability): Net Income divided by Revenue. This measures how much profit the company keeps from every dollar of sales, reflecting its pricing power and expense control.
- Asset Turnover (Efficiency): Revenue divided by Average Total Assets. This shows how effectively the company uses its asset base to generate top-line growth.
- Equity Multiplier (Leverage): Average Total Assets divided by Average Equity. This quantifies the company’s use of debt to finance its assets.
Mathematically, the denominators and numerators cancel out. Revenue and Assets disappear, leaving you with the original ROE formula of Net Income divided by Equity. This elegant cancellation proves that while the final number is ROE, the specific path taken to get there defines the quality of the business. Master this foundation, and you’ll be ready to tackle the more granular 5-step model used in institutional-grade analysis.
Deconstructing the Drivers: 3-Step vs. 5-Step DuPont Models
The 3-step model provides a solid foundation for corporate finance, but elite analysts require more granularity to uncover the truth behind a company’s performance. While the 3-step version lumps all profitability into a single net margin, the 5-step dupont analysis peels back the layers of the income statement. It separates core operating results from the impact of financing decisions and fiscal obligations. This level of detail is essential when evaluating companies with complex capital structures or those operating across multiple tax jurisdictions.
Junior analysts should opt for the 5-step model whenever they encounter heavily indebted firms or companies benefiting from international tax arbitrage. By isolating the Tax Burden and Interest Burden, you can determine if a company’s ROE is sustainable or merely a byproduct of favorable interest rates and tax credits. For those looking to dive deeper into these metrics, reviewing advanced return on equity analysis provides the institutional-grade perspective necessary for high-stakes decision-making.
The 5-Step Formula: Isolating Operating Performance
The 5-step formula expands the diagnostic into five distinct ratios: (EBIT / Sales) x (Sales / Assets) x (Assets / Equity) x (EBT / EBIT) x (Net Income / EBT). This breakdown introduces two critical components: the Interest Burden and the Tax Burden. The Interest Burden (EBT / EBIT) is particularly vital for LBO modeling, as it quantifies how much operating profit remains after servicing debt obligations. If this ratio is low, the company’s equity returns are highly sensitive to changes in borrowing costs, which is a major risk factor given the current federal funds rate of 3.5% to 3.75%.
The Tax Burden (Net Income / EBT) reveals how much of the pre-tax profit is retained after the government takes its share. With the U.S. federal corporate tax rate holding steady at 21%, any significant deviation in this ratio suggests the use of tax shields or exposure to varying state-level rates. Understanding these nuances is a core part of an Investment Banking Financial Modeling Course, where precision in earnings forecasting is non-negotiable.
Operational Efficiency vs. Financial Engineering
Asset Turnover remains the ultimate metric for assessing management competence. It measures how many dollars of revenue are generated for every dollar invested in the asset base. Unlike the Equity Multiplier, which can be inflated through financial engineering, Asset Turnover is difficult to manipulate. It reflects true operational efficiency. The Equity Multiplier acts as a double-edged sword; it magnifies ROE during periods of growth but accelerates losses when margins compress. The 5-step model is the standard for investment banking financial modeling because it forces the analyst to distinguish between these operational wins and purely financial maneuvers. To master these diagnostics across every deal type, consider the FMU All-Access Pass for a complete technical edge.
Strategic Interpretation: Analyzing Sector-Specific Business Models
Benchmarking a company against its peers requires more than a cursory glance at the bottom line. Professional analysts use dupont analysis to perform Peer Group Analysis, dissecting why two companies in the same sector arrive at the same ROE through different operational paths. This diagnostic approach allows you to identify which firm possesses a sustainable competitive advantage and which is masking inefficiency with financial engineering. Understanding these sector-specific nuances is what separates a junior spreadsheet jockey from an elite strategist.
The Retailer’s Playbook: Winning on Volume
The Software/SaaS Playbook: Winning on Scarcity
In the digital world, the Asset Turnover ratio is often low because these companies don’t require massive physical plants or equipment. Instead, Net Profit Margin is the primary lever. Tech giants leverage intellectual property to maintain high prices while keeping marginal costs low. However, this model changes when you pivot to capital-intensive sectors. In real estate financial modeling, for instance, leverage is a standard and expected driver of returns.
This raises the critical question: Is high leverage always bad? Not necessarily. In industries with highly predictable cash flows, such as Utilities or Project Finance, a high Equity Multiplier is often a strategic choice rather than a sign of distress. The goal isn’t to avoid debt, but to ensure the interest burden doesn’t outpace the return on assets. When the federal funds rate is 3.5% to 3.75%, your analysis must prove that the company’s operational efficiency can withstand the cost of its capital structure. Use the DuPont framework to validate that the leverage is supporting growth, not just subsidizing a failing operation.
Building the DuPont Framework in Excel: A Step-by-Step Modeling Guide
Integrating a dupont analysis into your model isn’t just about adding a few rows of math. It’s about creating a living diagnostic tool that responds to every change in your forecast. If you adjust your COGS assumptions or interest rate projections, your ROE diagnostic must immediately reflect the shift in net margin or interest burden. This requires clean data architecture and a strict adherence to the FMU standard of professional modeling. Without a dynamic link between your three statements and your ratios, your analysis remains a static snapshot rather than a functional tool.
One common mistake junior analysts make is comparing a full-year Income Statement figure to a year-end Balance Sheet figure. This creates a timing mismatch that distorts your results. To fix this, always use “Average Total Assets” and “Average Shareholder Equity” in your denominators. This ensures your efficiency and leverage ratios accurately represent the capital deployed throughout the entire reporting period. It provides a true reflection of management’s performance rather than a distorted figure skewed by year-end window dressing.
Step 1: Setting Up the Dynamic Data Links
Start by linking your core drivers directly from the source. Pull Sales, EBIT, EBT, and Net Income from the Income Statement. Then, pull Total Assets and Shareholder Equity from the Balance Sheet. Use “Anchor Cells” for your drivers to ensure the diagnostic updates as you change model assumptions. This structure is vital when running scenarios; if you change a tax rate assumption to reflect the current 21% federal flat rate, the impact should flow through your Tax Burden ratio without manual intervention.
Step 2: Calculating the Ratios and the Decomposition
Create dedicated rows for each component: Margin, Turnover, and the Equity Multiplier. Calculate the product of these ratios and verify that it matches your direct ROE calculation of Net Income divided by Average Equity. If the numbers don’t tie, your data links are likely flawed. Mastering Excel for finance is required to build these error-free tools that stand up to the scrutiny of a senior associate or VP.
The final step for institutional-grade modeling is the Sensitivity Table. Set up a two-variable data table to analyze how a 1% shift in operating margin or a 0.1x change in asset turnover impacts the final ROE. In an environment where the federal funds rate sits at 3.5% to 3.75%, understanding these sensitivities is critical for risk management. It allows you to present a range of outcomes to an investment board, proving that your analysis accounts for both operational volatility and macroeconomic shifts. To master these technical workflows, enroll in our Excel for Finance Course and build the technical stack used by elite practitioners.
Advancing Your Mastery: From Ratios to Institutional-Grade Analysis
Mastering the dupont analysis is more than a technical requirement. It is the bridge between basic accounting and high-level strategic advisory. Whether you are enrolled in a financial modeling course online or preparing for a seat at a top-tier firm, this framework provides the analytical rigor needed to transform raw data into institutional-grade insights. It is a foundational skill that dictates how you interpret credit risk and equity value in the real world.
In Equity Research, the framework allows you to identify a company’s “moat.” A business that consistently improves its asset turnover while maintaining high margins possesses a structural advantage. Conversely, Credit Analysis relies on the decomposition to assess default risk. By isolating the interest burden, you can determine if a company’s cash flows are sufficient to service debt in a high-rate environment. With the federal funds rate currently at 3.5% to 3.75%, this distinction is the difference between a sound investment and a distressed asset. Your ability to link these ratios to the broader economy is what signals your readiness for elite finance roles.
DuPont in the Investment Banking Interview
Expect the question: “Walk me through the drivers of ROE.” Most candidates will stumble through a basic 3-step definition. You will stand out by leading with the 5-step model. Explain how the interest burden and tax burden ratios provide a clearer picture of financial health than net margin alone. Mention that the flat 21% federal corporate tax rate acts as the baseline for your tax burden analysis. This specific, data-driven approach signals “Pro” status immediately. It shows you aren’t just reciting a textbook; you are applying a professional diagnostic to current market conditions. Link your findings to the company’s competitive advantage to close the loop on your technical narrative.
Use this final checklist to prepare for your next technical round:
- Memorize the 5-step formula: (EBIT/Sales) x (Sales/Assets) x (Assets/Equity) x (EBT/EBIT) x (Net Income/EBT).
- Identify the “Leverage Trap” where high ROE masks low asset efficiency.
- Compare the target company against industry-specific operating margins, such as the 35.3% average in Semiconductors.
- Explain the impact of the current 3.5% to 3.75% federal funds rate on the equity multiplier.
Mastering the Full Stack with FMU
Theory alone won’t secure a seat at a top-tier bank. You need the technical stack of an industry veteran. The FMU All-Access Pass provides the comprehensive training required to move from basic ratios to complex LBO and M&A modeling. Our curriculum bridges the gap between academic concepts and the high-stakes world of Private Equity. Beyond the screen, our one-to-one career mentoring serves as your personal roadmap to a top-tier offer. Don’t settle for average tutorials when you can access a proven blueprint for success. Master Financial Modeling Like the Pros with FMU University.
Elevate Your Analytical Edge to the Institutional Level
You’ve moved beyond the surface-level calculation of Return on Equity to understand the structural drivers of corporate performance. Mastering the dupont analysis gives you the diagnostic lens required to differentiate between sustainable operational growth and high-risk financial engineering. You now know how to isolate tax and interest burdens, benchmark across diverse sectors, and build dynamic Excel tools that withstand senior-level scrutiny. This technical precision is the hallmark of an elite finance professional who understands the “why” behind every number.
True career transformation requires moving from theory to flawless execution. FMU provides the exact blueprint used by industry leaders to dominate high-stakes deals. Trusted by 25,000+ finance professionals, our platform offers globally recognized certificates and downloadable institutional-grade Excel templates to accelerate your trajectory. Whether you’re targeting Private Equity or Investment Banking, the path to the top is structured and disciplined. Master Financial Modeling Like the Pros with FMU University. Take command of your professional future and perform at the level of the industry’s elite practitioners.
Frequently Asked Questions
What is the primary difference between the 3-step and 5-step DuPont Analysis?
The primary difference lies in the level of granularity regarding profitability and fiscal obligations. While the 3-step model provides a high-level view of margin, efficiency, and leverage, the 5-step dupont analysis isolates the specific impact of interest expenses and tax rates. This allows analysts to distinguish between core operating success and the effects of a company’s capital structure or tax strategy.
Why is DuPont Analysis better than looking at ROE alone?
DuPont Analysis is superior because it provides a diagnostic breakdown of the “why” behind the numbers. ROE alone is a summary metric that can easily hide structural weaknesses, such as excessive debt or declining asset efficiency. By deconstructing the ratio, you can identify whether a company’s returns are driven by sustainable operational excellence or temporary financial engineering.
Can DuPont Analysis be used for companies with negative earnings?
Yes, you can apply the framework to companies with negative earnings to pinpoint the specific source of the loss. While the final ROE will be negative, the individual components reveal whether the failure stems from razor-thin operating margins, high interest burdens, or underutilized assets. This diagnostic approach is critical for turnaround analysis and distressed debt modeling where identifying the “leak” is the priority.
How does financial leverage specifically affect the DuPont formula?
Financial leverage affects the formula through the Equity Multiplier, which acts as a mathematical lever for shareholder returns. As a company takes on more debt relative to its equity, the multiplier increases, magnifying the ROE. However, the 5-step model captures the “Interest Burden” to show how the cost of that debt eventually erodes the very profitability the leverage was intended to boost, providing a balanced view of risk.
What is a “good” Asset Turnover ratio in a DuPont context?
A “good” Asset Turnover ratio is entirely dependent on the specific industry benchmark and business model. In high-volume sectors like grocery retail, a ratio above 2.0 is often expected to compensate for low margins. Conversely, capital-intensive industries like telecommunications or utilities may operate successfully with ratios below 0.5. Always compare your results against a peer group to determine if management is utilizing assets efficiently.
How do I build a DuPont Analysis template in Excel for 2026?
Build your 2026 template by creating dynamic links between your three-statement model and a dedicated diagnostic tab. Use average balance sheet figures to prevent timing mismatches and ensure your formulas account for updated fiscal realities, such as the 15% Corporate Alternative Minimum Tax (CAMT) for large entities. Incorporate sensitivity tables to visualize how shifts in operating efficiency impact your final ROE forecast under different economic scenarios.
Is DuPont Analysis applicable to the banking and financial services sector?
The framework is applicable but requires modification for the banking sector due to unique capital structures and regulatory requirements. Banks operate with extremely high leverage and specialized income streams, so analysts often replace standard asset turnover with metrics like Net Interest Margin (NIM). While the core logic of deconstructing returns remains valid, the specific ratios must reflect the operational environment of financial institutions to be meaningful.
What are the main limitations of using the DuPont framework?
The main limitations include its reliance on historical accounting data and its inability to value intangible assets like brand equity or intellectual property. Since the dupont analysis is based on the balance sheet and income statement, it doesn’t account for future growth potential or market sentiment. Additionally, variations in accounting methods between GAAP and IFRS can make direct peer comparisons difficult without significant manual adjustments.


One Response