


A fund manager’s headline return tells you almost nothing on its own. Two managers can post the same 12% annual return, yet one got there by taking on twice the risk of the other.
To evaluate fund manager performance effectively, compare returns against a relevant benchmark and peer group, then adjust for risk using tools like the Sharpe ratio, Sortino ratio, and alpha. Add manager tenure, consistency across market cycles, and cost efficiency before drawing any conclusion. Raw returns alone will mislead you almost every time.
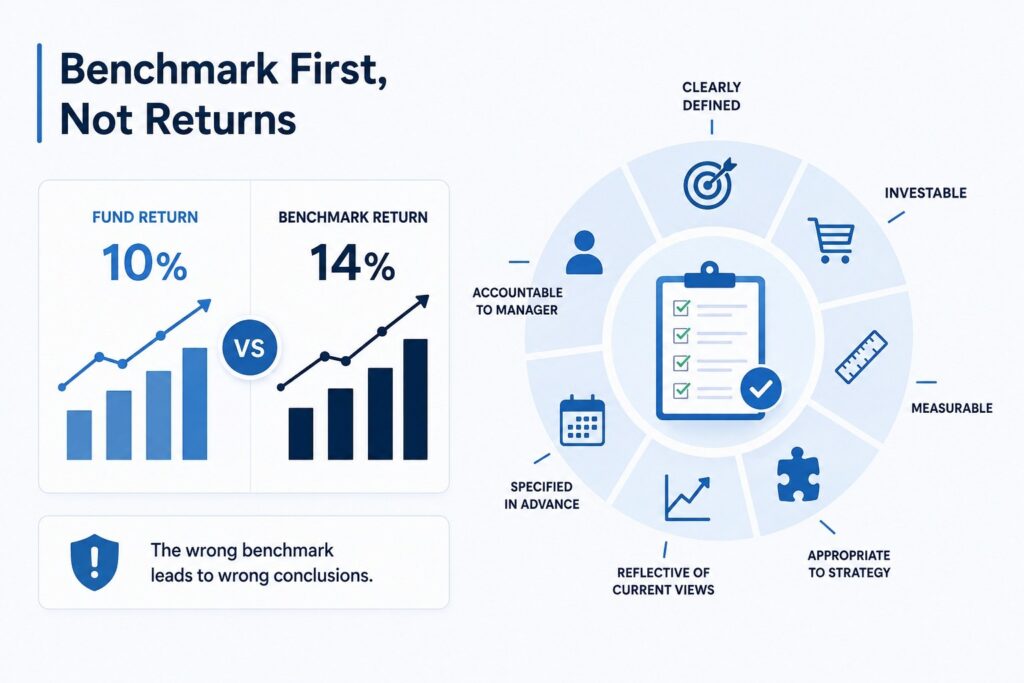
Returns only mean something in context. A fund that gained 10% looks strong until you learn its benchmark gained 14%.
A benchmark needs to actually fit the strategy it’s measuring. CFA Institute’s framework for benchmark quality lists seven tests a benchmark should pass: it should be unambiguous, investable, measurable, appropriate to the strategy, reflective of current investment views, specified before the evaluation period, and accountable to the manager.
If a fund is measured against the wrong index, every downstream conclusion about the manager’s skill becomes unreliable, since a misspecified benchmark invalidates the attribution and appraisal analysis built on top of it. Before trusting a manager’s track record, check that the stated benchmark actually matches the fund’s mandate, sector exposure, and market-cap focus.
Benchmark comparison shows performance against an index. Peer comparison shows performance against managers running similar mandates.
Comparing a fund across unrelated categories produces misleading conclusions, since different fund types carry different risk and return drivers by design.
Return alone answers “how much.” Risk-adjusted metrics answer “how well,” which is the real test of manager skill.
| Metric | What It Measures | Best Used For |
| Sharpe ratio | Return per unit of total risk (volatility) | Comparing managers with similar strategies |
| Sortino ratio | Return per unit of downside risk only | Evaluating managers in volatile or asymmetric markets |
| Alpha | Excess return after adjusting for market exposure | Isolating manager skill from market movement |
| Beta | Sensitivity of the fund to market swings | Understanding how much market risk the manager is taking |
| Appraisal ratio | Alpha relative to the fund’s unsystematic (manager-specific) risk | Judging skill independent of the manager’s benchmark bet |
| Upside/downside capture | How much of market gains and losses the fund captures | Seeing whether a manager protects capital in downturns |
| Maximum drawdown | Largest peak-to-trough decline before a new high | Gauging capital preservation and recovery ability |
A manager with a high Sharpe ratio delivered better returns for the risk taken than a manager with a lower Sharpe ratio, even if the second manager’s raw return was higher. This is usually the single most useful comparison point between two managers running comparable mandates.
Downside capture deserves particular attention. A manager who captures 90% of market gains but only 60% of market losses is protecting capital during downturns, which compounds meaningfully over a full market cycle even if their upside participation looks modest in any single strong year.

Numbers describe outcomes. They don’t explain whether those outcomes came from a repeatable process or a lucky call.
Tenure and continuity. A manager’s track record is only useful if that manager was actually running the fund the whole time. Check the start date of the current manager against the performance history being cited. Fund fact sheets sometimes display returns predating the current manager’s tenure.
Investment style consistency. A value manager who drifts into momentum names during a rally, then drifts back during a correction, is exhibiting style drift. This makes future performance harder to predict and often signals chasing returns rather than following a disciplined process.
Behavior in down markets. How a manager’s fund performed during a specific downturn tells you more about their risk management than five years of a rising market. Pull performance data for at least one meaningful drawdown period and see how the fund held up relative to its benchmark and peers.
A skilled manager can still deliver poor net-of-fee results if costs eat the alpha.

Investors and analysts fall into a few recurring traps when judging manager performance:
For analysts building out a full evaluation model, the same rigor used in equity research reports applies here: every conclusion about manager skill should be traceable back to a specific, verifiable metric rather than a narrative impression.

A complete manager evaluation checklist looks like this:
No single metric answers the question of skill on its own. Skilled managers tend to show up consistently across most of these checks, not just one favorable number.
Evaluating a fund manager effectively means moving past the headline return. Benchmark and peer comparison put performance in context. Risk-adjusted metrics like Sharpe, Sortino, and alpha separate genuine skill from excess risk-taking.
Tenure, style consistency, and downturn behavior confirm whether that skill is repeatable. Costs and turnover determine what actually reaches the investor. Run a manager through all of these checks together, and the picture that emerges is far more reliable than any single number could provide on its own.