


Every DCF model lives or dies on one number: the cash flow you choose to discount. Get FCFF wrong and the rest of the valuation, no matter how carefully built, inherits the error.
So let’s see how to calculate FCFF correctly, which formula to use depending on your starting point, and how to avoid the mistakes.
Free Cash Flow to Firm (FCFF) is the cash generated by a company’s operations that is available to all capital providers, debt holders and equity holders alike, after taxes, reinvestment in fixed assets, and working capital needs are covered.
It is also called unlevered free cash flow because it excludes the effects of financing decisions such as interest payments. The most common formula is:
FCFF = NOPAT + D&A − Capex − Change in NWC
Analysts use FCFF as the cash flow stream in enterprise-value DCF models, discounting it at the weighted average cost of capital (WACC).

FCFF is built to be capital-structure neutral. That means it strips out interest expense, debt repayments, and dividends, so the resulting figure reflects operating performance only, not how the company happens to be financed.
Two companies with identical operations but different debt loads should show the same FCFF, even though their net income and cash from financing activities would differ substantially.
This is the core distinction from Free Cash Flow to Equity (FCFE), which is the cash left over for common shareholders specifically, after debt service.
FCFF answers “how much cash does the business generate for everyone who funded it,” while FCFE answers “how much is left for shareholders after lenders are paid.”
| FCFF | FCFE | |
| Available to | All capital providers | Common equity holders only |
| Excludes | Nothing financing-related | Interest, net debt repayments already removed |
| Discount rate | WACC | Cost of equity |
| Used in | Enterprise value DCF | Equity value DCF |
A CFA Institute survey of practicing analysts found that discounted free cash flow models are used by roughly 87% of respondents when valuing equities, and among analysts using discounted cash flow approaches, FCFF-based models are applied roughly twice as often as FCFE-based ones.
That preference exists because FCFF sidesteps the noise of a company’s leverage decisions, making it easier to compare across firms with different capital structures.
Depending on which line item you have handy, financial statements, a projection model, or a partial data set, there are three standard entry points into FCFF. All three should converge on the same number when applied to the same company.
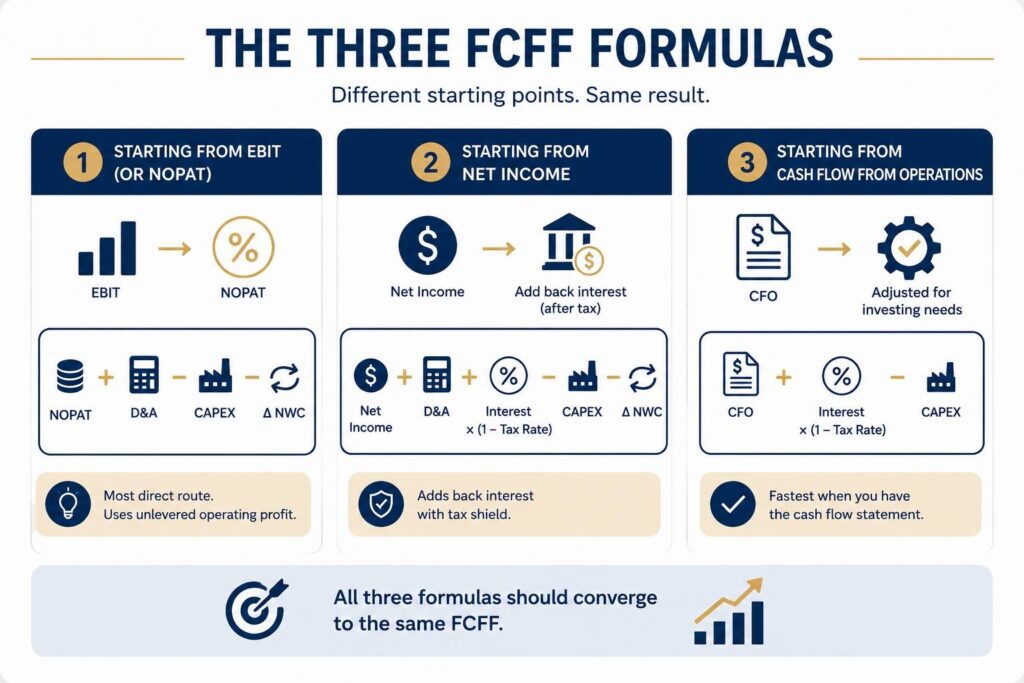
This is the most direct route and the one most financial models use, since EBIT is a clean, unlevered profit figure.
Step 1: Tax-affect EBIT to get NOPAT (Net Operating Profit After Tax).
NOPAT = EBIT × (1 − Tax Rate)
Step 2: Add back non-cash charges, subtract reinvestment.
FCFF = NOPAT + D&A − Capex − Change in NWC
Only recurring, core-operations non-cash items belong here. A one-time write-down or an asset sale gain should be excluded, since FCFF is meant to represent sustainable, ongoing cash generation, not one-off accounting noise.
Net income already reflects interest expense and taxes, so this formula has to add interest back and account for its tax shield.
FCFF = Net Income + D&A + Interest × (1 − Tax Rate) − Capex − Change in NWC
The interest add-back is tax-adjusted because interest expense already reduced the company’s taxable income. Adding back the full pre-tax interest amount would overstate FCFF, so only the after-tax portion is restored.
This is the fastest formula when a cash flow statement is already in hand, since CFO already incorporates working capital changes and non-cash adjustments.
FCFF = CFO + Interest × (1 − Tax Rate) − Capex
Note there’s no separate working capital adjustment here. CFO already nets that out, so subtracting it again would double-count the effect.
Assume the following figures for a mid-sized manufacturing company in its latest fiscal year:
| Line item | Amount |
| EBIT | $18.0m |
| Tax rate | 25% |
| D&A | $4.5m |
| Capex | $5.2m |
| Change in NWC | $1.1m |
Step 1: NOPAT = $18.0m × (1 − 0.25) = $13.5m
Step 2: FCFF = $13.5m + $4.5m − $5.2m − $1.1m = $11.7m
This is the cash the business generated for all its capital providers this year, before any consideration of how much debt it carries or how it chooses to pay lenders and shareholders.
To sanity-check using the CFO route, if this company reported CFO of $16.2m and paid $2.0m in interest at the same 25% tax rate: FCFF = $16.2m + $2.0m × 0.75 − $5.2m = $12.5m.
Small differences between routes are normal and usually trace back to non-core items sitting inside CFO or EBIT that weren’t stripped out consistently.

Once you calculate FCFF for the explicit forecast period, it’s discounted back at WACC to arrive at enterprise value, with a terminal value added for cash flows beyond the forecast horizon:
Firm Value = Σ FCFF_t / (1 + WACC)^t + Terminal Value
Equity value is then derived by subtracting net debt from enterprise value. Getting this discount rate right matters more than most analysts assume, since a small change compounds significantly across a multi-year forecast.
NYU Stern’s Aswath Damodaran, a widely cited authority on valuation methodology, frames this as a rule with no exceptions: never mix cash flows and discount rates.
Matching FCFF with WACC and FCFE with cost of equity, and never blending the two, is one of the DCF assumptions worth defending carefully before a model goes into a live deal.
FCFF strips away financing noise to show what a business actually generates for everyone who capitalized it.
Whether you start from EBIT, net income, or CFO, the destination is the same number, and getting there consistently, without mixing formulas or letting one-off items slip in, is what makes FCFF reliable enough to anchor a DCF valuation.