

A single logic error in a 2026 waterfall calculation can shift $450,000 in distributions between a General Partner and Limited Partner, yet 82% of junior analysts fail their first live modeling test because they lack a robust technical foundation. You already understand that real estate financial modeling is the definitive gateway to elite professional status in private equity; it’s the difference between being a data entry clerk and a strategic architect of a $150 million acquisition. It’s natural to feel intimidated by complex distributions or property-specific nuances like TMI and CAPEX, especially when your career trajectory depends on your ability to perform under pressure.
We agree that the margin for error in the high-stakes world of global finance is effectively zero. This guide provides the exact framework you need to master the technical architecture of institutional-grade models and the investment logic required to secure elite roles in REPE and Investment Banking. You’ll learn to build a robust model from scratch, navigate the incentive alignment in JV structures, and gain the professional credibility that comes with a recognized certification. We’re moving beyond abstract theory to provide a clear roadmap that transforms technical uncertainty into institutional-grade precision.
Key Takeaways
- Distinguish between basic templates and institutional-grade standards to ensure your analysis meets the rigorous demands of elite private equity firms.
- Master the technical architecture of real estate financial modeling by constructing robust assumptions hubs and dynamic operating cash flow projections.
- Navigate the distinct complexities of acquisition and development modeling, from analyzing value-add opportunities to managing intricate construction timelines.
- Decode the mechanics of JV waterfalls and promote structures to accurately map cash flow distributions and align incentives between investment partners.
- Bridge the gap between abstract theory and professional excellence to secure a definitive advantage in the competitive landscape of global finance.
What is Real Estate Financial Modeling (REFM)?
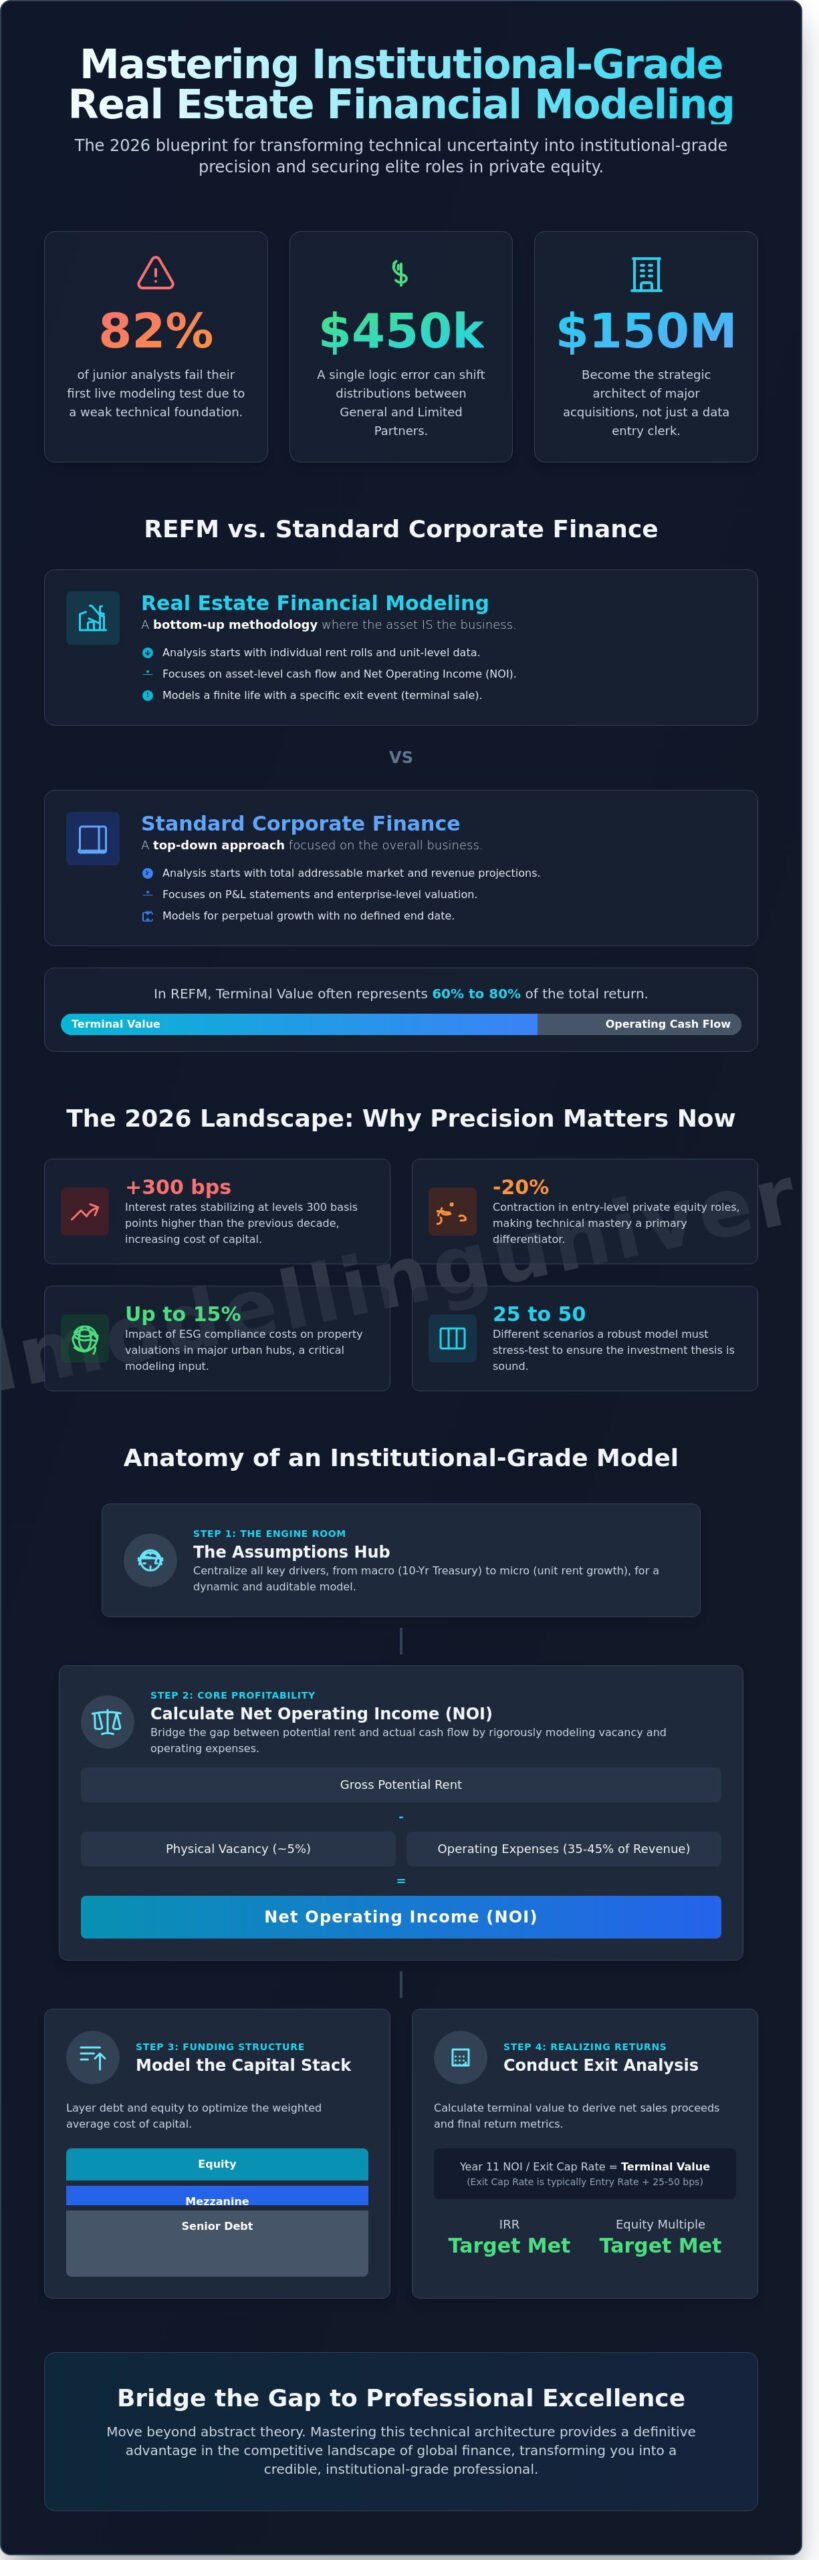
At its core, real estate financial modeling is the process of building a dynamic, mathematical representation of a property’s future economic performance. While basic Financial Modeling focuses on general business valuation, REFM is a precision tool used to translate physical property assumptions, such as lease expirations and capital expenditures, into a rigorous cash flow forecast. Institutional-grade models differ from amateur templates by accounting for complex joint venture waterfalls and granular recovery structures. Professionals in 2026 don’t settle for simple ROI calculations. They demand models that quantify risk-adjusted returns through Internal Rate of Return (IRR) and Equity Multiple targets across a 5 to 10 year holding period. The modeler’s role is to bridge the gap between the physical asset and the investor’s balance sheet, ensuring every square foot is accounted for in the final valuation.
REFM vs. Standard Corporate Finance
Corporate finance typically utilizes a top-down approach, starting with total addressable markets to project revenue. Real estate requires a bottom-up methodology. You must analyze individual rent rolls, unit by unit, to determine the Net Operating Income (NOI). Unlike a corporation that aims for perpetual growth, a real estate project has a finite life. The model must account for a specific exit event, usually a terminal sale based on a cap rate. This shift from P&L statements to asset-level cash flow is what separates the elite practitioner from the generalist. In this field, the asset is the business, and its terminal value often represents 60% to 80% of the total return.
The 2026 Landscape: Why Precision Matters Now
The margin for error has vanished. With 2026 interest rates stabilizing at levels 300 basis points higher than the previous decade, the cost of capital dictates every acquisition. Mastering real estate financial modeling is now the primary differentiator for associates facing a 20% contraction in entry-level private equity roles. Models must now incorporate ESG compliance costs, which can impact property valuations by up to 15% in major urban hubs. Recruiters at firms like Blackstone or Starwood now prioritize candidates who build dynamic sensitivity tables over those using static inputs. A robust model must stress-test 25 to 50 different scenarios, ensuring the investment thesis survives a volatile 2026 economy. Technical mastery isn’t optional; it’s the baseline for professional survival.
The Core Components of an Institutional-Grade Model
Precision in real estate financial modeling begins in the Assumptions Hub. This is the engine room where you define macro drivers, such as the 10-Year Treasury rate, and micro inputs like unit-level rent growth. An institutional model isn’t a static spreadsheet; it’s a dynamic simulation that adjusts every output based on these central variables. High-performance models isolate these inputs to ensure that a single change in a 2.5% inflation assumption ripples accurately through the entire 10-year pro forma.
To calculate Net Operating Income (NOI), you must bridge the gap between Gross Potential Rent and actual cash flow. This requires rigorous modeling of physical vacancy, often pegged at 5.0% for stabilized assets, and operating expenses that typically range from 35% to 45% of total revenue in competitive markets. Mastery of these institutional real estate modeling concepts ensures your projections withstand the scrutiny of a rigorous investment committee.
Your capital stack layers senior debt with mezzanine and equity tranches to optimize the weighted average cost of capital. Exit analysis then determines the terminal value. By applying an exit cap rate, usually 25 to 50 basis points higher than the entry rate, to the Year 11 NOI, you derive the net sales proceeds necessary to calculate the internal rate of return (IRR) and equity multiple. If you want to move beyond basic templates, you should explore advanced certification paths to refine your technical execution.
Modeling the ‘Food Groups’: Property Type Nuances
- Multifamily: Focus on the unit mix. Modeling a 200-unit development requires accounting for a 50% annual turnover rate and the loss-to-lease dynamic, which represents the delta between current market rates and actual signed contracts.
- Office/Retail: These assets demand granular modeling of Tenant Improvements (TIs) and Leasing Commissions (LCs). In 2026, expect Class A office TIs to exceed $100 per square foot for new builds.
- Industrial: These models utilize triple-net (NNN) structures where tenants cover taxes and insurance. The focus shifts to specialized CAPEX, such as $15,000 HVAC replacements or roof work every 15 years.
The Debt Schedule: Beyond Simple Interest
Institutional real estate financial modeling requires a sophisticated debt schedule. Construction draws must follow an S-curve distribution rather than a linear path. You’ll need to model interest reserves that capitalize the carry costs during a 24-month build phase. Advanced analysts layer multiple debt tranches to maximize leverage while monitoring the DSCR. The Debt Service Coverage Ratio (DSCR) serves as the primary metric for lender risk assessment. Lenders typically require a minimum 1.25x coverage to ensure the property generates enough income to service its annual obligations.
Modeling Different Deal Types: Acquisition vs. Development
Distinguishing between an acquisition and a ground-up development is the first test of a practitioner’s precision. While both require real estate financial modeling proficiency, the risk profiles and cash flow structures are worlds apart. An acquisition focuses on the immediate capture of existing cash flow; development is an exercise in managing uncertainty across a multi-year horizon. Whether you’re analyzing a stabilized Class A office or a speculative multifamily build, your model must reflect the specific operational realities of the asset’s lifecycle.
The Acquisition Framework
Acquisition modeling centers on the entry basis. You’ll build a robust sources and uses table that accounts for the purchase price plus 2.0% to 3.5% in transaction costs. Professional models typically project a 5, 7, or 10-year hold period. These durations aren’t arbitrary; they mirror the typical 10-year fund life of institutional private equity. You’ll need to master Key Metrics for Real Estate Investment Analysis to determine if a stabilized asset’s 4.5% cap rate justifies the equity commitment. For “Value-Add” opportunities, your model must also layer in the timing of capital improvements and the subsequent “mark-to-market” rental growth. The success of these value-add strategies often depends on implementing sophisticated real estate asset management techniques that can translate operational improvements into measurable IRR enhancement.
The Development Deep Dive
Development modeling demands a granular approach to the project timeline. You must segment the model into three distinct phases: Pre-Construction (entitlements and permits), Construction (the vertical build), and Lease-up (reaching stabilization). Budgeting requires a rigorous split between hard costs and soft costs, with a mandatory 5.0% to 8.0% contingency reserve to buffer against material price volatility. The ultimate benchmark for any developer is the spread between the Yield on Cost and the prevailing Exit Cap Rate. An elite modeler looks for a 150 to 300 basis point “development spread” to compensate for the 24 to 36 months of zero cash flow during construction.
Renovation or repositioning projects introduce the J-curve effect. You’ll model heavy capital expenditures in the first 12 to 18 months, causing a temporary dip in net cash flow before rental premiums of 10% to 15% are achieved. This requires a dynamic real estate financial modeling setup that can handle monthly granularity and complex debt draws. The “To Buy or Not to Buy” threshold is rarely just about the IRR. It’s about whether the project’s risk-adjusted return exceeds your firm’s 18% hurdle rate while maintaining a debt service coverage ratio (DSCR) above 1.25x throughout the transition.
Mastering the Complexity: JV Waterfalls and Promote Structures
In the high-stakes arena of institutional private equity, the waterfall is the definitive mechanism for capital allocation. It governs the transition from simple pro-rata splits to performance-based distributions. At its core, the waterfall maps how every dollar of exit proceeds is partitioned between Limited Partners (LPs) and General Partners (GPs). Mastery of real estate financial modeling requires you to move beyond basic cash flows and into the rigorous logic of tiered returns. You aren’t just building a spreadsheet; you’re codifying a legal agreement that dictates millions in profit sharing.
The “Promote” serves as the GP’s primary incentive. It allows the sponsor to earn a disproportionate share of profits once specific performance benchmarks are met. For example, a GP contributing 5% of the equity might receive 20% of the profits after the LP achieves a 12% Internal Rate of Return (IRR). To maintain fairness, institutional deals often include “Catch-ups” and “Clawbacks.” A catch-up allows the GP to recover their percentage of the total profits once the LP hits their hurdle. Conversely, a clawback provision, common in 95% of institutional joint venture agreements in 2025, forces the GP to return over-distributed funds if the overall project performance underdelivers at the final exit.
The Logic of Incentive Alignment
LPs agree to give up upside because it aligns interests. If the GP generates alpha, everyone wins. The “Preferred Return,” often set at 8% for core-plus assets in 2026, ensures LPs receive their capital and a baseline profit before the GP sees a dime of the promote. This structure protects the passive investor while challenging the sponsor to exceed standard market returns. To master these mechanics, you should study our How to Model a Real Estate Waterfall Distribution guide for a step-by-step technical breakdown.
Building the Waterfall in Excel
Precision in real estate financial modeling is non-negotiable when dealing with complex hurdles. You must use a tiered logic approach, typically utilizing the MIN and MAX functions to isolate cash flows within specific IRR or Equity Multiple buckets. This prevents the “double-counting” of profits across different tiers. Every elite modeler includes a “Check” line at the bottom of the distribution tab. A valid waterfall model must always be a zero-sum calculation where the sum of partner distributions equals the total cash available for distribution. If your check line shows even a $0.01 variance, the model is fundamentally broken and unfit for an investment committee.
Ready to build institutional-grade models that stand up to the scrutiny of global private equity firms? Enroll in our elite financial modeling certification today.
Elevating Your Career with Professional REFM Mastery
Technical mastery serves as the definitive gateway to elite professional status in 2026. In an environment where 85% of private equity candidates fail the initial technical screening, your ability to build a dynamic waterfall or a complex debt schedule is your most valuable currency. Real estate financial modeling isn’t just a technical requirement; it’s a signal of professional discipline and cognitive rigor. High-performance training delivers a clear ROI. Data from 2024 compensation benchmarks indicates that analysts with certified modeling expertise command 22% higher base salaries than their non-certified peers. This technical edge provides job security that abstract degrees simply can’t match.
FMU’s Real Estate Financial Modeling Course
Our curriculum moves you beyond abstract theory into the high-stakes world of institutional-grade execution. You’ll gain access to the same templates used by global private equity firms to underwrite multi-billion dollar acquisitions. We don’t just teach Excel; we teach the logic of the deal. Every student receives 1-on-1 career mentoring from seasoned practitioners who’ve spent decades in the trenches of global investment banking. You’ll prepare for the industry’s most grueling interviews through our rigorous modeling tests and case studies based on actual 2025 market transactions.
Securing Your Future in Global Finance
A recognized certification acts as a rigorous filter for serious, informed candidates. It’s the difference between being a resume in a pile and being a shortlisted contender for a Tier-1 associate role. You’ll learn to leverage your credentials on LinkedIn and within high-level networking circles to signal your technical craftsmanship. This transition from analyst to associate requires a shift from simple data entry to high-level strategic interpretation. You aren’t just learning a software skill; you’re building a foundation for long-term financial leadership. The most successful professionals understand that modeling is only the beginning—once you’ve acquired an asset, maximizing its performance through disciplined real estate asset management strategies becomes the critical differentiator between average and exceptional returns. Join the FMU All-Access Pass and Master Real Estate Modeling Today to secure your seat at the table and dominate the competitive landscape.
Secure Your Seat at the Investment Committee Table
Winning in the 2026 market requires more than a basic understanding of spreadsheets. It demands a mastery of real estate financial modeling that can withstand the scrutiny of a billion-dollar private equity fund. You’ve now seen how institutional-grade models separate high-performing assets from costly mistakes. By mastering complex JV waterfalls and granular acquisition structures, you’re not just calculating internal rates of return; you’re building a foundation for long-term financial leadership. The difference between a junior analyst and a lead associate often comes down to the reliability of their debt schedules and promote logic under pressure.
Don’t leave your career trajectory to chance in a competitive landscape where 95% of applicants lack the technical depth required for elite roles. You need the exact tools used by the top 1% of investment professionals. Access over 150 downloadable institutional-grade Excel templates and earn a certification recognized by 500+ global private equity firms. You’ll also benefit from 1-on-1 career mentoring with practitioners who have closed over $10 billion in career deal volume.
Master Institutional-Grade REFM with the FMU All-Access Pass
The path to the executive suite is paved with precision. Start building your legacy today.
Frequently Asked Questions
Is real estate financial modeling harder than investment banking modeling?
Real estate financial modeling isn’t harder than investment banking, but it requires a different technical focus on asset-level granularity. While an LBO model focuses on corporate cash flows, a REFM model accounts for specific lease expirations across 50 unique tenants. You’ll spend 40% of your time on the debt and equity waterfall. This often exceeds the complexity of a standard three-statement model.
What is the most important metric in a real estate financial model?
The Internal Rate of Return (IRR) remains the primary metric for assessing time-weighted performance in real estate financial modeling. Institutional funds targeting value-add assets in 2026 typically look for an 11% to 15% net IRR. You must pair this with the Equity Multiple. A 2.0x multiple over a five-year hold provides the absolute profit context that a percentage alone cannot convey.
Can I use a standard DCF model for a real estate development project?
You can’t use a standard corporate DCF for development; it fails to account for the negative cash flows of 24-month construction cycles. Development models require monthly periodicity to track the S-curve of capital expenditures and interest capitalization. If you ignore the specific timing of 100% of your upfront costs, your NPV will be off by 15% or more. Accuracy is non-negotiable for institutional deals.
How long does it take to learn institutional-grade REFM?
Mastering institutional-grade REFM takes approximately 100 hours of focused technical training and case study execution. This isn’t just about learning Excel shortcuts; it’s about understanding how to structure a 10-year pro forma from scratch. Most analysts reach professional proficiency after building 5 complete models. This ensures you can handle the 4-hour modeling tests used by top-tier private equity firms.
Do I need to be an Excel expert before starting a real estate modeling course?
You don’t need to be an expert, but you must be comfortable with 10 core logical and lookup functions before starting. Proficiency with INDEX, MATCH, and OFFSET is non-negotiable. If you can’t navigate a workbook without a mouse, you’ll struggle with the speed required in a professional environment. We recommend a 10-hour Excel intensive to bridge the gap before diving into asset-level calculations.
What is a ‘Promote’ in a real estate waterfall and how is it modeled?
A promote is the disproportionate share of profits paid to a sponsor after the Limited Partners receive their capital and a preferred return. It’s modeled using a tiered waterfall structure where the GP might earn 20% of profits after hitting an 8% IRR hurdle. This aligns interests. Precision is vital because a single error can misallocate 5 million in carry during the final distribution phase.
How do high interest rates affect real estate financial models in 2026?
High interest rates in 2026 directly compress the Debt Service Coverage Ratio, often forcing it below the 1.25x threshold required by lenders. When the SOFR increases by 150 basis points, your debt service costs rise and your terminal cap rates expand. This demands a 30% increase in sensitivity analysis. You must model various interest rate hedges to protect the project’s 5-year viability.
What is the difference between levered and unlevered IRR in REFM?
Unlevered IRR calculates the return of the property without the influence of debt, reflecting the pure quality of the asset. Levered IRR accounts for the impact of financing, showing the actual return on equity to the investors. If you use 65% Loan-to-Value debt, you’ll see a 700 basis point spread. This distinction is critical for risk assessment during the due diligence phase.


One Response