


93% of executives rely on financial models for strategic decision-making, yet many analysts still dread the moment their Balance Sheet refuses to balance. It is the ultimate test of technical proficiency in investment banking. If you’ve ever struggled with circular reference errors that crash Excel or felt lost tracing how specific line items flow through the statements, you’re not alone. This 3 statement financial model tutorial provides the blueprint to master the core engine of finance with the precision of an industry insider.
We understand the pressure of performing at the level of elite practitioners. You need more than a static template; you need a dynamic, fully-linked engine that stands up to the rigors of a 2026 market environment where the federal corporate tax rate remains 21% and the effective federal funds rate sits near 3.63%. This guide promises to transform your technical approach. We will walk through the exact steps to build an institutional-grade model from scratch, ensuring you understand how every data point connects across the three statements. Master these fundamentals and you’ll gain the confidence to ace any technical modeling test and perform like a pro.
A 3-statement model is the dynamic representation of a company’s financial health. It serves as the primary engine for any institutional-grade analysis. Professionals at the highest levels of investment banking and private equity view these integrated financial statements not as separate documents, but as a single, living organism. This 3 statement financial model tutorial will show you how to build this “operating system” to support complex DCF, LBO, and M&A models. Without a robust 3-statement foundation, advanced transaction modeling is impossible.
Logic is everything in finance. Every transaction has a footprint that spans multiple sheets. If a company generates one dollar of revenue, that dollar moves through a specific path. It’s taxed, adjusted for non-cash items, and eventually reconciles on the Balance Sheet. Mastery requires you to visualize this flow before you ever touch a cell in Excel. At FMU, we focus on this level of technical rigor to ensure your models are defensible under the scrutiny of senior partners.
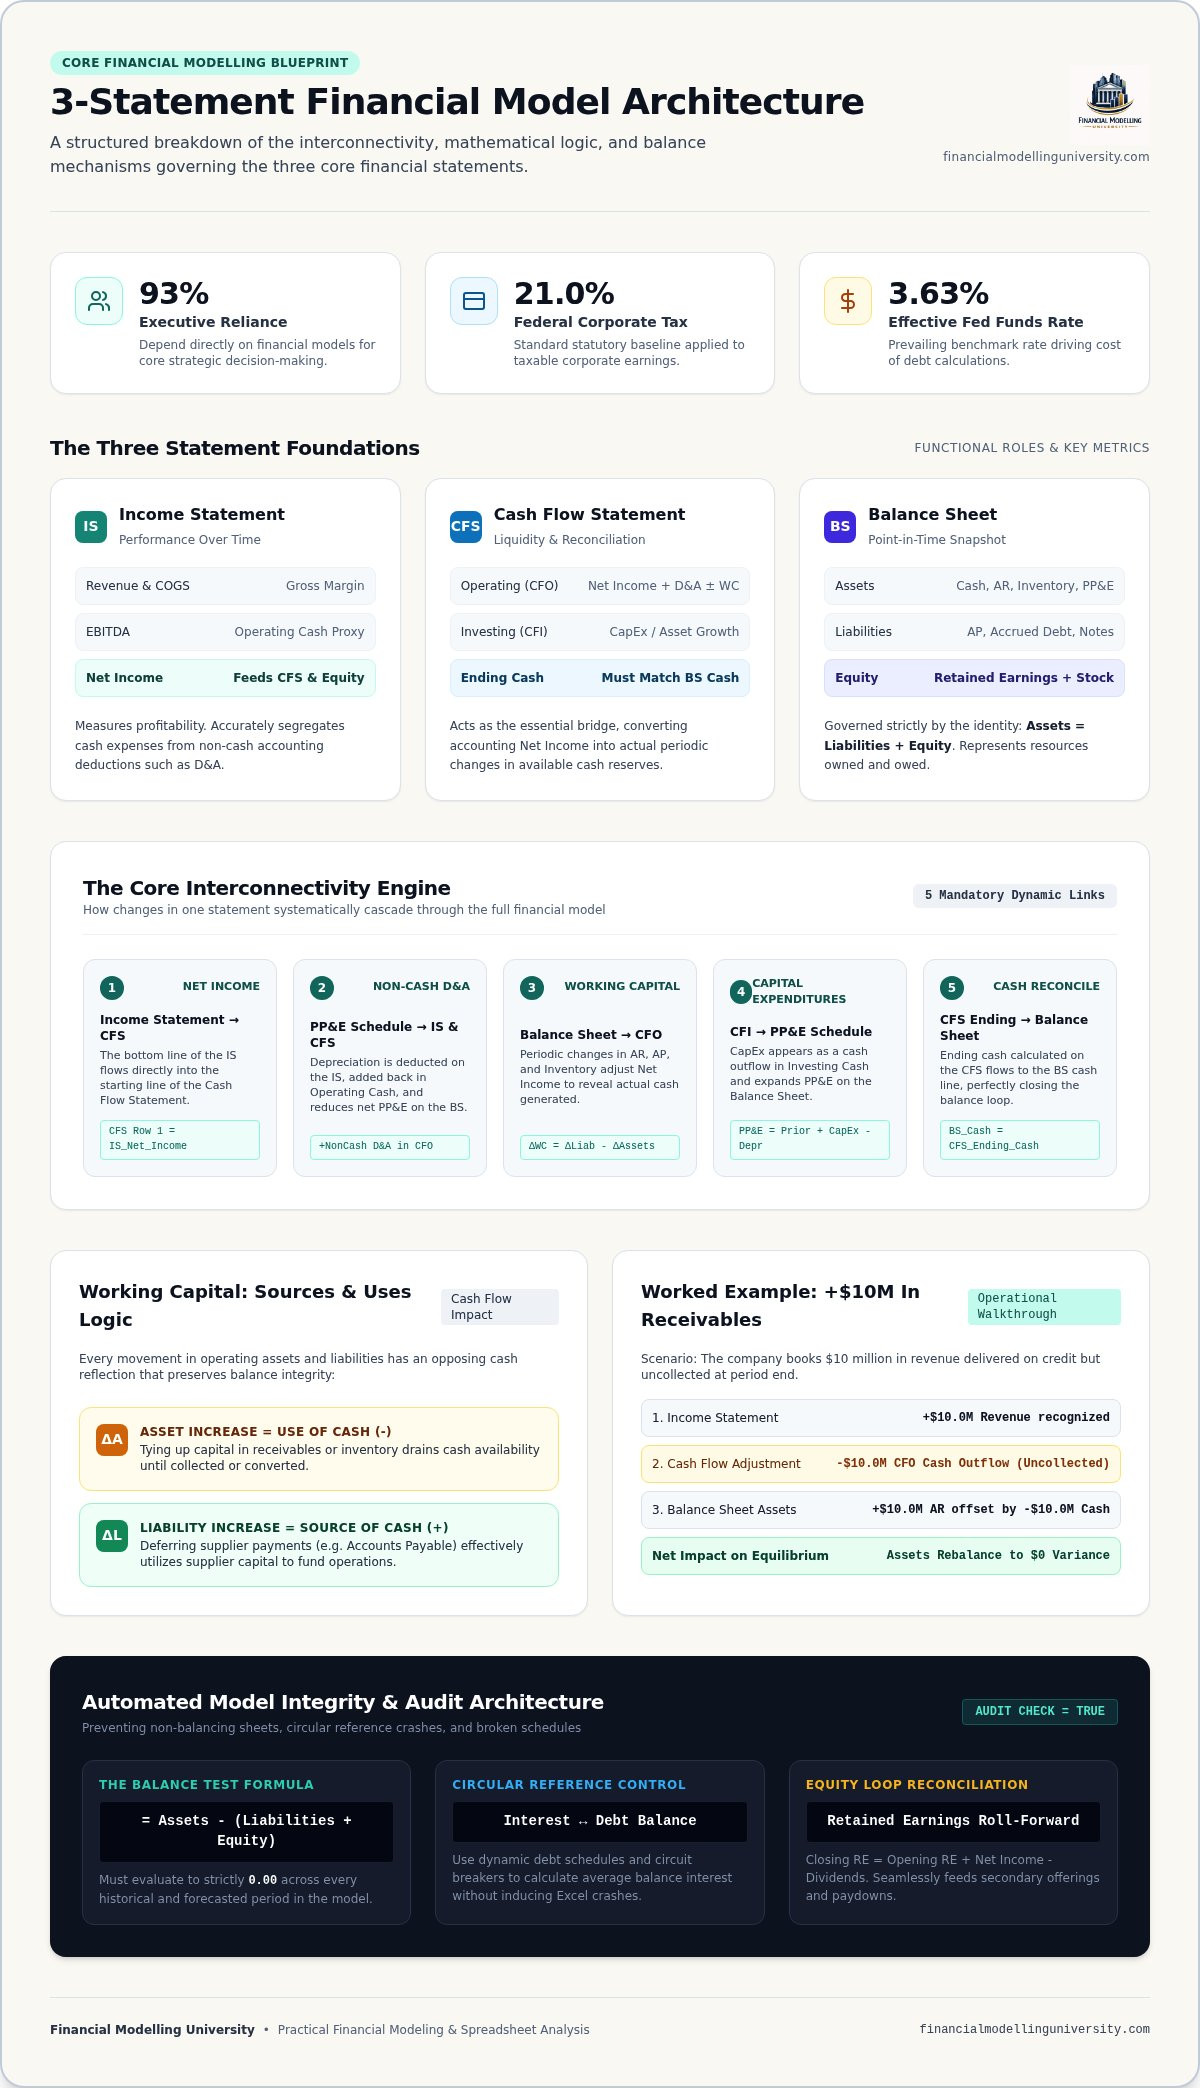
This statement tracks a company’s ability to generate profit over a specific period. You’ll focus on Revenue, COGS, and Operating Expenses to arrive at EBITDA. This metric is a vital proxy for operating cash flow. However, the real work begins at Net Income. This “bottom line” figure serves as the critical starting point for your Cash Flow Statement. You must accurately distinguish between cash and non-cash expenses, such as Depreciation and Amortization, to ensure your model reflects economic reality rather than just accounting conventions.
The Balance Sheet follows the fundamental equation: Assets = Liabilities + Equity. It is a snapshot of what the company owns and owes at a specific point in time. The Cash Flow Statement acts as the essential bridge, explaining exactly how Net Income transforms into the change in Cash. For your model to be institutional-grade, the “Ending Cash” on the CFS must perfectly match the “Cash” line item on the Balance Sheet. If it doesn’t, your model is broken. Master Financial Modeling Like the Pros by respecting the internal logic that keeps these statements in balance. This discipline is what separates a professional analyst from a beginner.
The structural integrity of your model depends entirely on its architecture. In this 3 statement financial model tutorial, we focus on the rigid logic of interconnectivity that defines professional-grade work. Every entry in a 3-statement model must have a corresponding offset to keep the Balance Sheet in equilibrium. This is not just an accounting rule; it is the mathematical foundation that ensures your model remains dynamic. If you record an asset purchase without an offsetting cash outflow or debt increase, your Balance Sheet will break instantly.
Mastering the circular nature of these statements is what separates elite analysts from those who rely on static templates. Net Income feeds into Retained Earnings within the Equity section. Equity decisions, such as issuing dividends, then feed back into the Cash Flow Statement (CFS). The resulting change in cash updates the Balance Sheet, completing the loop. This cycle must be automated with precision to handle complex scenarios like debt paydowns or secondary offerings.
Working capital logic is a frequent pain point for junior analysts. You must internalize the “Sources and Uses” framework: an increase in Assets is a use of cash. If Accounts Receivable grows by $10 million, you’ve recognized revenue but haven’t collected the cash. This must appear as a negative adjustment on the CFS. Conversely, increasing a liability like Accounts Payable is a source of cash. You’re effectively using your suppliers’ capital to fund your operations. Capital Expenditure (CapEx) follows a similar logic, linking the Investing section of the CFS directly to the PP&E schedule on the Balance Sheet. This asset then generates Depreciation, which flows back to the Income Statement as a non-cash expense.
The loop closes when the “Ending Cash” from the CFS flows back to the Cash line on the Balance Sheet. Simultaneously, Retained Earnings are updated by adding Net Income and subtracting Dividends. To handle the complex logic required for these multi-layered links, you should master advanced formula nesting in our Excel for Finance Course. This ensures your architecture remains robust and your Balance Sheet stays in perfect equilibrium as you scale the model’s complexity.
Circularity is the technical hurdle that separates amateur templates from institutional-grade models. In this 3 statement financial model tutorial, we address the core challenge: interest expense is calculated based on debt balances, but those balances are determined by the cash flow remaining after interest is paid. This creates a mathematical loop. To manage this safely, you must implement a “Circularity Switch.” This is a simple 1/0 toggle in your assumptions that breaks the loop, allowing you to troubleshoot without Excel crashing.
Professional analysts don’t fear circularity; they control it. By using an IF statement in your interest expense calculation, you can “kill” the circularity instantly to verify the rest of your model’s logic. This “Circuit Breaker” methodology is a requirement in elite investment banking environments. It ensures that if the model breaks, you can isolate the debt schedule from the core statements to find the error. Mastering this toggle is a hallmark of the FMU standard.
Your debt schedule must follow a strict “Cash Waterfall” logic. Senior debt obligations are met first, followed by subordinated tranches. The Revolver acts as the ultimate “plug” for the model. If your cash balance falls below a defined minimum, the model must automatically draw from the Revolver to cover the shortfall. Conversely, when the company generates excess liquidity, you implement a “Cash Sweep” to pay down the Revolver or optional term loan prepayments. Calculate interest on the average of the beginning and ending debt balances to maintain accuracy, even though this reinforces the circularity.
If your Balance Sheet doesn’t balance, your first stop isn’t the Balance Sheet itself. Check the Cash Flow Statement. Most errors are signage-related, specifically within the “Change in Working Capital” section. Remember the rule: an increase in an asset is a negative cash flow. If you’ve incorrectly mapped these, your cash balance will be off, and the model won’t reconcile. Use Excel’s “Trace Precedents” tool to audit the Interest Expense line. Tracing the logic back to the debt schedule often reveals broken links or hard-coded numbers that should be dynamic formulas. Discipline in these audit checks is what guarantees a model’s integrity under pressure.
Building an institutional-grade model requires a disciplined, sequential approach. This 3 statement financial model tutorial follows the exact workflow used by bulge-bracket banks. You don’t start with projections. You start with the past. Constructing the model from a blank sheet ensures you understand every link and prevents the “black box” syndrome common in junior analysts who rely on inherited templates.
The process is linear but requires constant verification. Follow these five steps to ensure structural integrity:
Cleaning your data is the first step toward professional mastery. Identify and remove non-recurring items, such as one-time legal settlements or restructuring costs, to normalize EBITDA. This provides a clear view of the company’s core earning power. Calculate efficiency ratios to inform realistic future assumptions. If historical DSO has averaged 45 days, projecting a sudden drop to 30 days without a strategic catalyst is a technical red flag. For advanced insights into selecting the right drivers for specific sectors, see our Investment Banking Financial Modeling guide.
Forecasting revenue is the most critical driver. You can base this on simple percentage growth rates or more sophisticated unit-level drivers like volume and price per unit. Once the Income Statement is projected, link the “Bottom Line” Net Income to the CFS and the “Ending Cash” back to the Balance Sheet. This closes the model loop. Always remember that a model is only as good as its assumptions; garbage in, garbage out. To master these technical workflows under the guidance of elite mentors, explore our Investment Banking Financial Modeling Course today.
Adhere to strict color-coding to ensure your model is “client-ready” from the first cell. Use blue for all hardcoded inputs, black for formulas on the same sheet, and green for links that reference other tabs. This visual shorthand allows a senior associate or VP to audit your logic in seconds. Once your base case is established, use Data Tables to perform sensitivity analysis. Analyzing how your outputs react to changes in WACC or terminal growth rates provides the “so what” that senior stakeholders demand. Master these standards now, as they are the absolute prerequisite for more complex paths like Private Equity Financial Modeling.
Professionalism in Excel is defined by clarity and discipline. Remove gridlines immediately to create a clean, white canvas. Use consistent border styles and font sizes to guide the reader’s eye through the financial narrative. One of the most important rules for junior analysts: never hide rows or columns. Hidden data is an audit nightmare. Instead, use the “Group” function (Alt + A + G + G) to collapse supporting schedules while maintaining structural transparency. Use the “F5” trick (Go To > Special > Constants) to quickly highlight and verify all hardcoded numbers, ensuring no rogue formulas have been overwritten during the build.
Your model must include an automated “Check” tab that aggregates error flags from every sheet. At the bottom of your Balance Sheet, build a dedicated “Balance Check” row that calculates Assets minus Liabilities and Equity. In the world of professional finance, a 0.01 difference is a failure. Only a 0.00 result is acceptable. This check should be linked to a master alert at the top of every sheet so you can identify a break the moment it occurs. Ready to master financial modeling like the pros? Enroll in the FMU All-Access Pass today to gain the technical edge required for career transformation.
Building an institutional-grade model is the ultimate technical litmus test for any aspiring finance professional. By mastering the rigid interconnectivity of the three core statements and implementing professional-grade debt schedules, you’ve moved beyond basic spreadsheet tasks. This 3 statement financial model tutorial has provided the blueprint used by elite industry practitioners. Now, it’s time to apply these standards to live deal scenarios where precision and speed are paramount.
Success in investment banking requires a commitment to continuous technical evolution. Trusted by 25,000+ finance professionals, FMU offers the academic rigor and practical application needed to transform your career. Our training includes institutional-grade Excel templates and one-to-one career mentoring from industry experts who know exactly what it takes to perform at the highest level. Don’t settle for average skills when professional excellence is within reach.
Master Financial Modeling Like the Pros with FMU University
The path to the C-suite is disciplined and highly structured. You have the foundation; now, take the lead and secure your future in finance.
Signage errors in the “Change in Working Capital” section are the most frequent cause of model failure. Junior analysts often forget that an increase in an asset, like Accounts Receivable, represents a use of cash. Correcting this requires a disciplined “Sources and Uses” mindset. Always verify that every Balance Sheet movement has a corresponding, correctly signed entry on the Cash Flow Statement to maintain structural integrity.
Locate the error by auditing the Cash Flow Statement before touching the Balance Sheet. If the model doesn’t balance, the break usually exists in the bridge between Net Income and Ending Cash. Ensure your “Change in Working Capital” links are correct and that your “Ending Cash” on the CFS perfectly matches the Cash line on the Balance Sheet. Use a dedicated “Balance Check” cell to identify the exact dollar variance instantly.
We add back Depreciation and Amortization because they are non-cash accounting charges that reduce Net Income without affecting actual liquidity. While these items decrease taxable income on the Income Statement, the cash remains within the company. Reversing these charges on the Cash Flow Statement is a critical step in this 3 statement financial model tutorial to reconcile accounting profit with true economic cash flow.
A professional analyst should complete a standard 3-statement build from a blank sheet in 60 to 90 minutes. This timeframe is the benchmark for investment banking technical interviews. For more complex, institutional-grade models involving detailed operating segments and intricate debt waterfalls, the process may take several days. Speed is a result of repetition and a deep internalization of the core financial links.
Excel remains the undisputed industry standard for financial modeling due to its unparalleled flexibility and transparency. While specialized software exists, it often functions as a “black box” that senior partners and clients cannot easily audit. Master Excel to ensure your work is portable and universally accepted across investment banking, private equity, and corporate finance departments. It provides the granular control necessary for complex transaction modeling.
You don’t need to be a CPA, but you must master the fundamental “flow” of financial data between statements. Understanding how a transaction affects Assets, Liabilities, and Equity is more important than memorizing niche accounting standards. Focus on the mechanics of the three statements. This foundational knowledge is what allows you to build defensible models that reflect the economic reality of a business.
A Cash Sweep is a mechanism where excess cash flow is automatically used to pay down outstanding debt. In a professional model, this logic is usually applied to the Revolver or optional term loan repayments. This ensures that the company prioritizes deleveraging before accumulating idle cash. Implementing a sweep requires a robust debt schedule that interacts dynamically with the cash balance on the Balance Sheet.
Circular references can lead to model instability or “frozen” values if Excel’s iterative calculation settings aren’t managed correctly. In this 3 statement financial model tutorial, we recommend using a “Circularity Switch” to break the loop during troubleshooting. This circuit breaker prevents the model from crashing when errors occur in the debt or interest schedules. It is a hallmark of elite, institutional-grade modeling standards.