


The difference between a mid-level analyst and an elite private equity professional isn’t just their ability to use Excel; it’s their mastery of the capital structure. While many can input numbers into a template, few can navigate a complex debt schedule or articulate how a 9% senior debt interest rate impacts the final exit valuation. If you’ve ever felt lost trying to link three financial statements in a high-pressure environment, you’re not alone. This leveraged buyout analysis example provides the clarity you need to move beyond basic templates and into the realm of institutional-grade modeling.
We’ve designed this guide to bridge the gap between academic theory and the rigorous demands of 2026 deal-making. You’ll learn to build a functional LBO model from scratch, mastering the mechanics of how leverage transforms a stable company into a high-octane equity return. We’ll break down the $2 trillion debt maturity wall context and use current SOFR-based pricing to ensure your analysis stands up to the scrutiny of any investment committee. By the end of this guide, you’ll be able to calculate IRR and MOIC with the precision required to pass technical private equity interviews and lead real-world transactions.
A Leveraged Buyout (LBO) is the acquisition of a company where the buyer uses a significant amount of borrowed money, such as bonds or loans, to meet the cost of the transaction. In a professional leveraged buyout analysis example, the target company’s assets typically serve as collateral for the debt. The company’s own cash flows are then used to pay down that debt over time. This structure allows private equity firms to acquire large businesses without committing a massive amount of their own capital. It’s a high-stakes strategy that requires precision and a deep understanding of capital structures.
Private equity sponsors utilize LBOs primarily to amplify equity returns. By using leverage, the sponsor can achieve a higher Internal Rate of Return (IRR) than they would by using 100% equity. This methodology also establishes what we call a “Floor Valuation.” This represents the maximum price a financial sponsor can afford to pay for a business while still achieving their target IRR. It’s a critical benchmark in any competitive bidding process. If the price exceeds this floor, the returns no longer justify the risk.
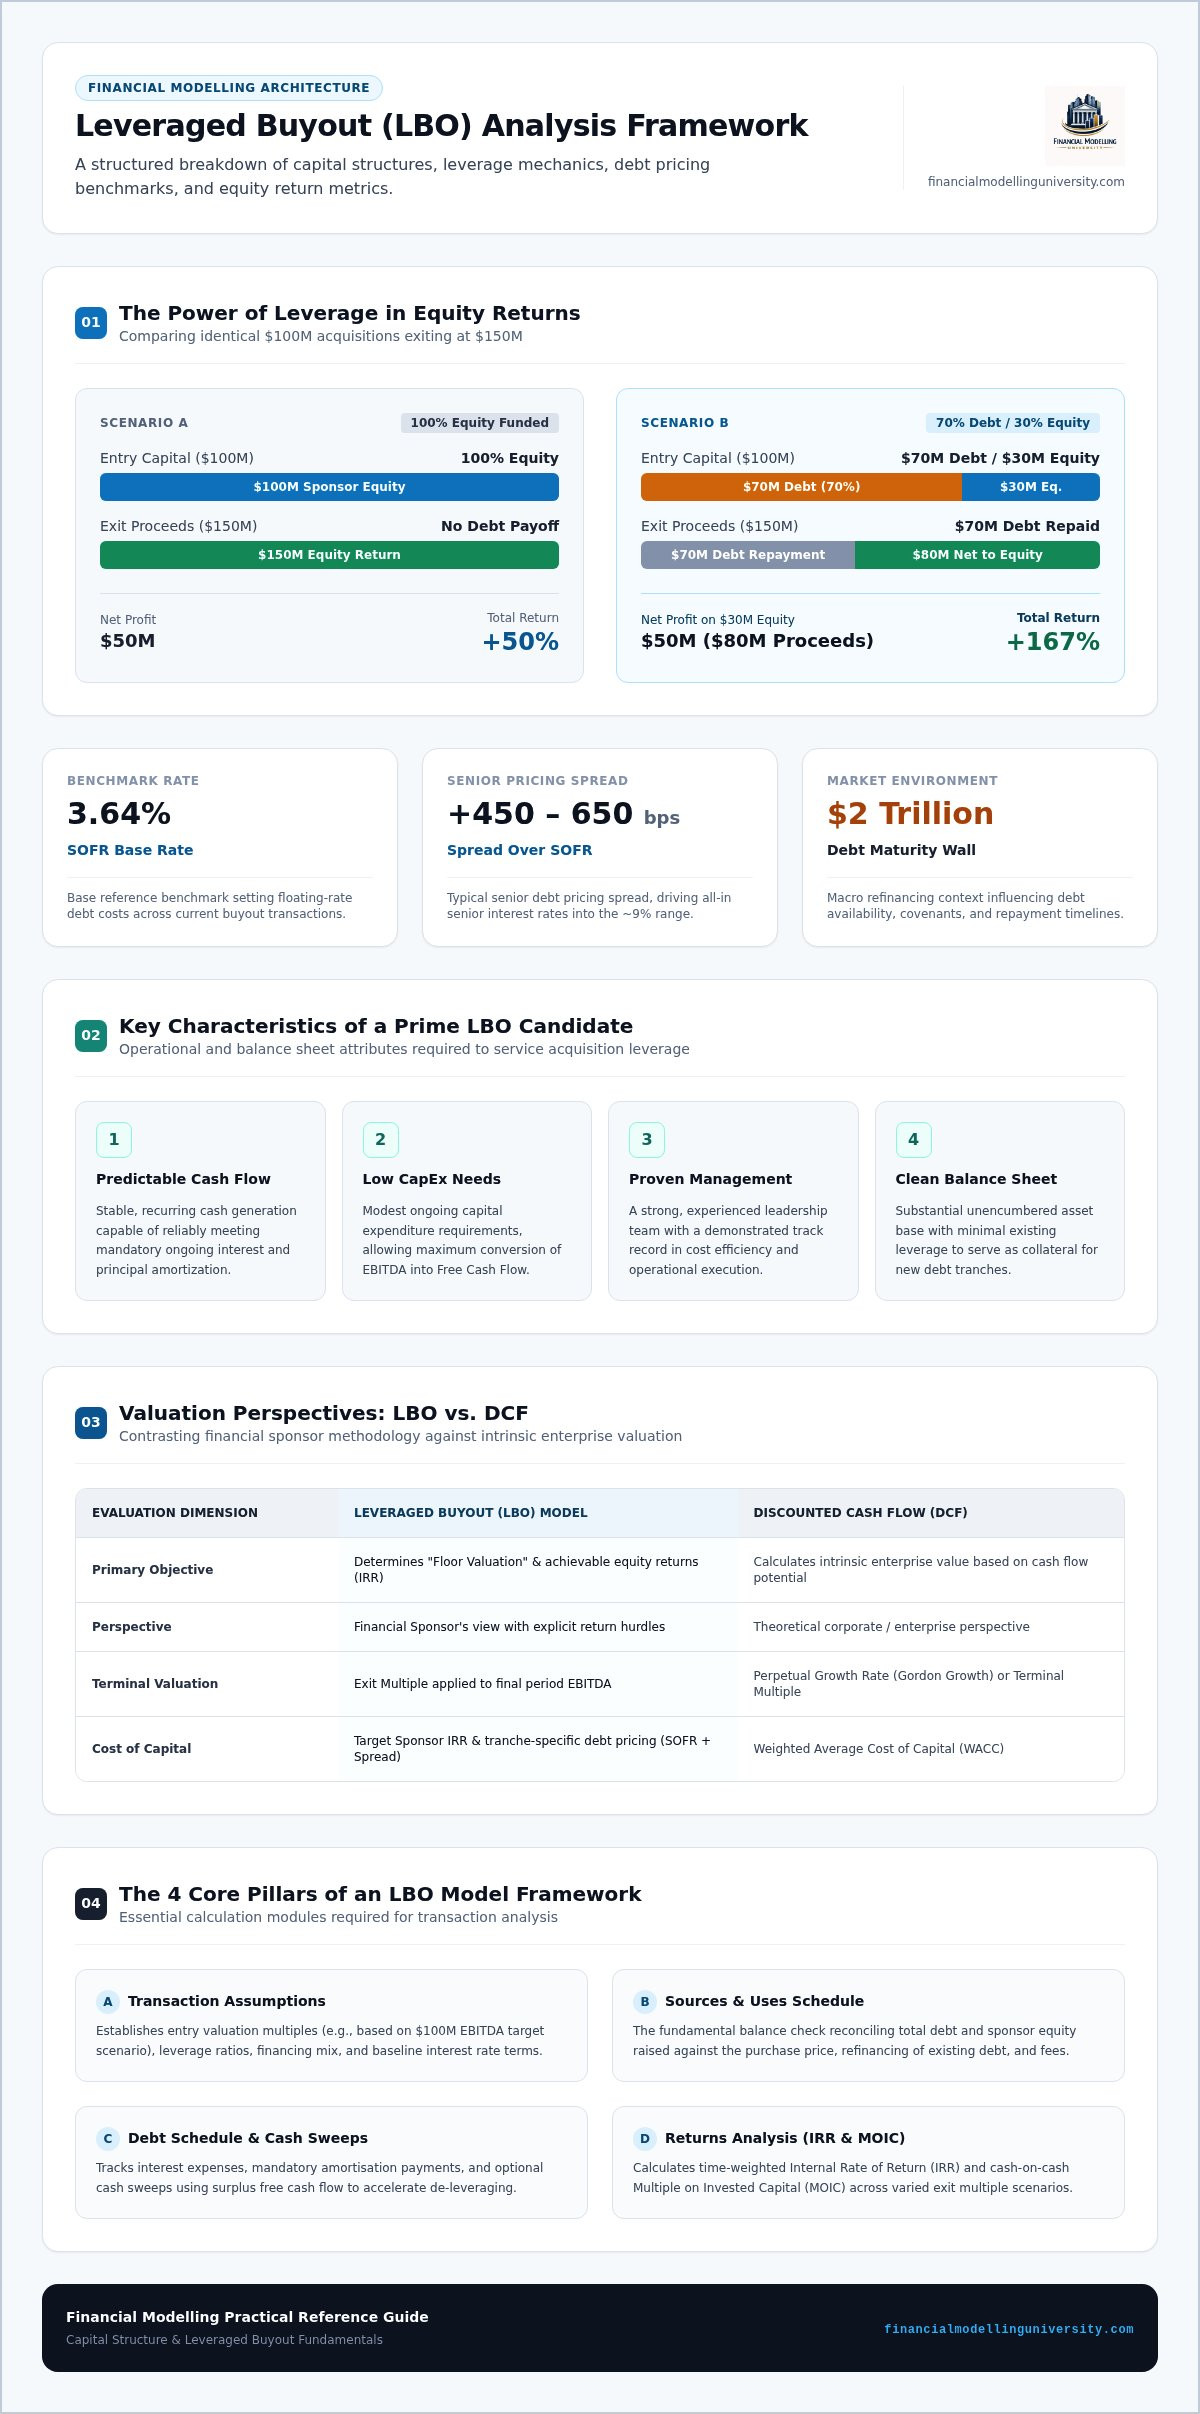
Not every business is a fit for this strategy. Elite professionals look for specific characteristics in a prime LBO candidate:
Leverage acts as a financial fulcrum. Consider a transaction where you buy a company for $100 million. If you fund it with 100% equity and sell it for $150 million, your return is 50%. However, if you fund that same acquisition with $30 million in equity and $70 million in debt, a $150 million sale price yields an $80 million return on your initial $30 million investment after paying off the debt. That is a 167% return. This mathematical effect is why leverage is the engine of the private equity industry. It also introduces significant risk. If the company’s value drops, the equity holder loses their investment first while the debt remains fixed.
While a Discounted Cash Flow (DCF) model focuses on intrinsic value based on a company’s weighted average cost of capital, LBO analysis is a “sponsor’s view” of valuation. In an LBO, the “exit multiple” assumption replaces the “terminal value” used in a DCF. The goal isn’t just to find what a company is worth in a vacuum. You’re trying to determine what it’s worth to a buyer with a specific cost of capital and return hurdle. Sophisticated investment banking financial modeling often integrates both perspectives to provide a comprehensive valuation range. Using a leveraged buyout analysis example helps analysts understand how these two methodologies diverge in real-world scenarios.
Constructing a robust LBO model requires more than just high-level assumptions; it demands a precise structural framework that mirrors institutional standards. Every leveraged buyout analysis example begins with the Transaction Assumptions. This includes setting the entry multiple, determining the debt-to-EBITDA ratios, and forecasting interest rates. As of January 28, 2026, the SOFR rate sits at 3.64%, with senior debt typically pricing at SOFR plus 450 to 650 basis points. These inputs dictate the feasibility of the entire deal. Understanding the Leveraged Buyout Model involves recognizing how these variables interact to influence the final equity return.
Beyond the initial assumptions, you must build a comprehensive Debt Schedule. This manages mandatory repayments and optional “cash sweeps,” where excess cash flow is used to pay down debt principal ahead of schedule. On the Pro-forma Balance Sheet, you’ll need to account for the new capital structure, the refinancing of existing debt, and the creation of Goodwill. This ensures the model reflects the company’s financial position the moment the deal closes.
The Sources and Uses table is the foundational balance check of your model. Sources represent where the capital originates, including Senior Debt, Mezzanine financing, and the Sponsor Equity contribution. Uses detail where that capital is deployed, such as the purchase price of the target, refinancing old debt, and transaction fees. Sources must always equal Uses in a professional model. If these figures don’t match, your balance sheet won’t balance, and your analysis will lack credibility in a professional setting.
Linking the three financial statements is where many analysts struggle. In an LBO, the Income Statement is heavily impacted by new interest expenses and Depreciation and Amortization write-ups. The Cash Flow Statement becomes the most critical lens, as it determines the Free Cash Flow (FCF) available for debt paydown. Every dollar of debt repaid increases the equity value for the sponsor. Mastering these technical connections requires a high level of proficiency in Excel for finance to ensure accuracy and speed. If you’re looking to refine these skills, our specialized training provides the exact blueprints used by elite private equity firms to audit-proof their models.
Let’s apply the theoretical framework to a concrete leveraged buyout analysis example. Imagine “IndustrialCo,” a manufacturing firm with a steady $100M EBITDA. To acquire this business at an entry multiple of 10.0x EV/EBITDA, the total Enterprise Value (EV) equals $1 billion. We must also account for transaction costs. In 2026, M&A advisory fees typically range from 1% to 5% of the deal value. For this scenario, we’ll assume $20 million in fees and financing costs, bringing the total transaction value to $1.02 billion.
Step two involves determining the funding mix. A standard institutional structure for IndustrialCo might involve 4.0x debt and 6.0x equity. This equates to $400 million in total debt and $620 million in sponsor equity. Based on January 2026 data, the SOFR rate is 3.64%, and senior debt is pricing at SOFR plus a spread of 450 to 650 basis points. For our model, we’ll set the all-in interest rate at approximately 9.5% to reflect current market conditions.
Calculating the equity contribution requires a clear Sources & Uses table. If IndustrialCo has no existing debt to refinance, the “Uses” side is simple: $1 billion for the purchase price and $20 million for fees. The “Sources” must match this $1.02 billion. We’ll utilize $400 million in senior secured loans and $620 million in equity from the private equity fund. This 40:60 debt-to-equity ratio provides a balanced risk profile while still offering significant room for return amplification through the holding period.
In more complex leveraged buyout analysis example scenarios, you might include mezzanine debt with a PIK (Payment-in-Kind) component. PIK interest isn’t paid in cash but is instead added to the principal balance, preserving liquidity during the early years of the investment. By year five, assuming an exit multiple of 10.0x on a projected $127M EBITDA, the Ending Enterprise Value reaches $1.27 billion. After paying off the remaining debt, the residual equity value represents the sponsor’s total return on the investment.
Building the model is only half the battle. Interpreting the results is where you prove your value as an investment professional. In our IndustrialCo leveraged buyout analysis example, the numbers tell a specific value creation story. This narrative is driven by the “Three Levers” of LBO returns: deleveraging, operational growth, and multiple expansion. Deleveraging occurs as you use free cash flow to pay down debt principal. Operational growth happens when you increase EBITDA through margin expansion or revenue gains. Multiple expansion is the most speculative lever, occurring when you sell the business at a higher valuation multiple than you paid at entry.
Elite analysts don’t just look at the final cash balance; they dissect how each lever contributed to the total return. If your return is purely driven by multiple expansion, the deal carries higher risk. Conversely, a return driven by significant debt paydown and EBITDA growth suggests a more resilient investment thesis. Understanding these drivers allows you to defend your assumptions during a rigorous investment committee review.
Private equity firms balance two primary return metrics: Internal Rate of Return (IRR) and Multiple of Invested Capital (MOIC). While MOIC measures the total cash-on-cash return, IRR accounts for the time value of money. A high MOIC with a low IRR can be a “fund killer” because it ties up capital for too long, dragging down the fund’s overall performance. Most institutional sponsors target a 20-25% IRR and a 2.0x-3.0x MOIC.
| Metric | Definition | Formula | Pros | Cons |
|---|---|---|---|---|
| IRR | Annualized time-weighted return. | (Exit Proceeds / Entry Equity)^(1/t) – 1 | Accounts for the time value of money. | Highly sensitive to the timing of cash flows. |
| MOIC | Total cash-on-cash return. | Total Cash Inflows / Total Cash Outflows | Simple to understand and communicate. | Ignores how long it took to achieve the return. |
No leveraged buyout analysis example is complete without a sensitivity analysis. This technical exercise uses Excel data tables to show how returns fluctuate if your core assumptions change. You’ll typically build a two-variable table to cross-reference the Exit Multiple against the Year of Exit. This helps you identify the “Breakeven” point where the investment meets your fund’s minimum hurdle rate. If you’re serious about mastering these institutional-grade techniques, our private equity financial modeling course provides the exact templates and advanced sensitivity logic used by elite practitioners at Goldman Sachs and KKR.
The leveraged buyout analysis example we’ve explored with IndustrialCo serves as a vital foundation. However, the models used by elite private equity firms like Goldman Sachs and KKR involve layers of complexity that go far beyond basic templates. Professional modeling requires managing multi-tranche debt structures, complex tax attributes, and dynamic transaction timing. Transitioning from a simple spreadsheet to an institutional-grade model is the single most important step for any aspiring investment professional. You must move beyond just “getting the model to work” and start building tools that are audit-proof, flexible, and capable of driving multi-billion dollar investment decisions.
Senior Managing Directors demand precision. They expect models that can withstand rigorous stress testing without breaking. This means every formula must be transparent and every link must be logical. Error-checking isn’t just a final step; it’s a core component of the build process. Mastery in this field comes from understanding the nuances of debt covenants, revolving credit facilities, and the subtle interplay between the three financial statements under high leverage.
Many candidates rely on self-taught methods that fail under the scrutiny of a technical interview. Common mistakes include circular reference errors in the interest schedule, incorrect treatment of deferred tax assets, and a reliance on “plug” figures to force a balance sheet to tie. These errors signal a lack of disciplined training. The “FMU Standard” eliminates these risks. We teach you to build models that are clean, fast, and institutional-grade. Our career mentoring goes beyond the technical, helping you articulate the strategic story behind the numbers. You won’t just present an IRR; you’ll explain exactly which value creation levers are driving it.
The LBO Modeling Course at FMU is designed to transform your technical capabilities. Our curriculum takes you through the entire deal lifecycle, from initial transaction assumptions to advanced sensitivity analysis. You’ll work with the same blueprints used by top-tier analysts to master complex debt waterfalls and equity incentive plans. Completing this training earns you a globally recognized certificate that serves as a powerful resume booster, signaling your readiness for the intensity of a private equity role.
Don’t settle for basic tutorials. Secure the FMU All-Access Pass to gain comprehensive expertise across all modeling disciplines. This is your opportunity to move from learning the theory to executing like an industry insider. Take control of your career trajectory and start performing at the highest level. Master Financial Modeling Like the Pros with FMU.
Mastering the mechanics of a private equity deal requires more than just understanding the math. It demands a strategic grasp of how leverage, operational growth, and multiple expansion work together to drive elite returns. You’ve seen through this leveraged buyout analysis example how a disciplined approach to the Sources and Uses table and debt paydown schedules can transform a standard valuation into a compelling investment thesis. Now, it’s time to bridge the gap between theory and the high-stakes reality of the industry.
Financial Modelling University is trusted by 25,000+ finance professionals who seek to perform at the highest level. We provide downloadable institutional-grade Excel templates and one-to-one career mentoring from industry experts to ensure you’re ready for any technical challenge. Move beyond basic tutorials and start building the models that MDs actually trust.
Master LBO Modeling Like the Pros: Enroll in the FMU LBO Course Today
The path to career transformation starts with a commitment to technical excellence. Take the next step and build the professional future you’ve envisioned.
Institutional private equity sponsors typically target an Internal Rate of Return (IRR) between 20% and 25%. This hurdle rate compensates investors for the high risk, leverage, and illiquidity associated with private equity assets. While some top-tier funds may accept slightly lower returns for stable, large-cap businesses, anything below 15% is generally considered insufficient for a standard LBO thesis.
You calculate Sources and Uses by identifying where the capital originates and exactly how it is deployed at the close of the transaction. Sources include senior debt, mezzanine financing, and the sponsor’s equity contribution. Uses represent the purchase price of the target, the refinancing of any existing debt, and M&A advisory fees, which in 2026 typically range from 1% to 5% of the deal value. The two sides must always balance perfectly.
The three primary exit strategies for a leveraged buyout are a strategic sale to a corporate buyer, a secondary buyout by another private equity firm, or an Initial Public Offering (IPO). Strategic sales often command the highest premiums due to synergy realizations. Secondary buyouts have become increasingly common, representing a significant portion of deal volume as funds seek to deploy record levels of dry powder.
EBITDA serves as the primary metric because it acts as a proxy for the operating cash flow available to service debt, regardless of the company’s capital structure or tax environment. It allows analysts to compare businesses across different industries and tax jurisdictions. Since an LBO relies on the company’s ability to generate cash to pay down principal, EBITDA provides the most transparent view of a firm’s debt-carrying capacity.
A ‘Paper LBO’ is a simplified, mental-math exercise used to quickly assess deal feasibility during interviews or initial screenings. It focuses on high-level entry and exit multiples without detailed financial statements. In contrast, a full leveraged buyout analysis example involves a comprehensive three-statement model with detailed debt schedules, tax shielding, and working capital projections to ensure institutional-grade precision.
High interest rates in 2026 directly compress equity returns by increasing the cost of debt service and reducing the free cash flow available for principal paydown. With senior debt pricing at SOFR plus 450 to 650 basis points, resulting in all-in rates of 9% to 11%, sponsors must rely more heavily on operational EBITDA growth. This environment favors companies with high margins that can withstand elevated interest expenses.
Yes, an LBO performed on a public company is known as a ‘take-private’ transaction. This process involves the sponsor offering a premium to current shareholders to acquire all outstanding shares and delist the company from public exchanges. Take-privates allow management to focus on long-term operational improvements without the pressure of quarterly earnings reports and public regulatory scrutiny.
A ‘Dividend Recap’ occurs when a private equity firm issues new debt to pay a special dividend to shareholders, effectively returning capital to the sponsor before a full exit. This maneuver often improves the IRR of a leveraged buyout analysis example by accelerating cash inflows to the equity holders. However, it increases the company’s total leverage and interest burden, which can elevate the risk of financial distress if cash flows falter.